📝 产品详情
Forecast PRO MT4
| 作者 | Gesang Pangestu |
| 版本 | v3 |
| 激活数 | 5 |
| 原价 | $35 USD |
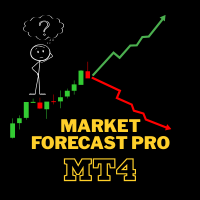
ForecastPro is a price projection indicator based on historical pattern similarity. In simple terms, it searches for past price segments that closely resemble the current price pattern, then “borrows” the subsequent movement from that historical pattern and projects it forward.
Key Features
- Data Source
- Training Data Length
- Reference Length
- Forecast Length
- Forecast Type
-
Prediction: After finding a similar historical pattern, the indicator takes the movement that followed that pattern and maps it onto the current price.
-
Replication: The indicator takes another aligned historical movement segment and reproduces its shape.
- Forecast Direction Type
Options: Peak-Trough or Average.
Peak-Trough: Forecast direction color is determined by comparing the endpoint of the sample with its anchor point.Average: Direction is based on the average of the forecast sample relative to the anchor, making it smoother and less sensitive.
- Forecast Line
The projected price path drawn on MT4.
- Divergence Cone (optional)
- Dashboard
How It Works
The indicator builds a price series based on the selected source, then searches for the most similar historical pattern using Pearson correlation.
Best Match Bars Back indicates how many bars ago the best matching pattern begins.
Once a match is found, the indicator constructs the forecast path based on the selected mode (Prediction or Replication), then determines the forecast direction to assign bullish or bearish coloring.
It also calculates Matching Probability, which is a heuristic score (not a pure statistical probability). It combines correlation quality and forecast dispersion. Higher correlation and lower dispersion generally result in a better score.
-
Matching Probability: Confidence score of the model. Higher values indicate a better match with more consistent projections.
-
Correlation: Similarity between the current pattern and historical data. Closer to 1 means more similar.
-
Best Match Bars Back: Position of the best historical match.
-
Mode: Combination of Forecast Type and Direction Type.
-
Source: Price source used.
-
Forecast End: Estimated price at the end of the projection.
Important Notes
-
This indicator is based on historical matching, not guaranteed prediction.
-
Forecast results may change as new ticks arrive or as the best match shifts.
-
Larger Training Length, Reference Length, and Forecast Length increase computational load.
-
Matching Probability should be interpreted as a quality score, not a guaranteed trade success rate.
How to Use
-
Use the indicator to assess potential price direction, not as a standalone entry signal.
-
Always consider market structure: trending, ranging, or volatile/news conditions.
-
Align the forecast direction with the higher timeframe trend.
-
Use Correlation and Matching Probability as filters for match quality, not as guarantees.
-
Better entries usually come from pullbacks or confirmation candles, not from chasing the projection endpoint.
Recommended Modes
-
Prediction + Average: Most stable and safest for daily use. Recommended as the default.
-
Prediction + Peak-Trough: More aggressive and sensitive. Suitable for impulsive or breakout markets, but noisier.
-
Replication + Average: Works well in ranging or rhythmically repeating markets.
-
Replication + Peak-Trough: Most aggressive and prone to error unless the market is strongly repetitive. Use with caution.
Tips for Better Accuracy
-
For general use, start with HLC3 or Close as the source. These are usually more stable than Open.
-
In trending markets: use Prediction + Average.
-
In fast breakouts: use Prediction + Peak-Trough.
-
In ranging markets: use Replication + Average.
Enable Divergence Cone only if you want to visualize forecast scenarios or ranges. For cleaner entries, it’s often better to keep it off.
As a general guideline:
-
Correlation above 0.65
-
Matching Probability above 50
are considered more reliable zones.
Avoid taking forecast signals that go against the higher timeframe trend.
Suggested Default Setup
If you want a simple and reliable starting setup:
HLC3 + Prediction + Average, and use it only when the forecast aligns with the higher timeframe trend and both Probability and Correlation are reasonably strong.
安全须知
本产品仅通过 MQL5.com 官方渠道获取。其他渠道版本可能缺少完整功能和技术支持。
EA 配置
| 交易品种 | XAUUSD |
| 时间框架 | H1 (推荐) |
| 推荐经纪商 | IC Markets, IC Trading |
| 最低存款 | $300 / 0.01手 |
📸 截图预览