📝 产品详情
RSI Divergence Pulse MT4
| 作者 | Ivan Stefanov |
| 版本 | v2 |
| 激活数 | 20 |
| 原价 | $50 USD |
RSI Divergence Pulse — Smart Divergence Scanner with MTF Panel, Zone Fill, Alerts & Dashboard
SHORT DESCRIPTION
Professional RSI indicator with automatic Regular & Hidden divergence detection, color-coded RSI line, Multi-Timeframe panel, OB/OS zone fills, Buy/Sell arrows, signal labels, real-time dashboard, and multi-channel alerts. Works on any symbol and timeframe.
═══════════════════════════════════════════════════════════
FULL DESCRIPTION
═══════════════════════════════════════════════════════════
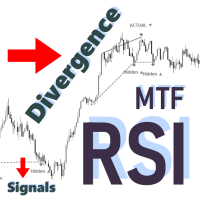
RSI Divergence Pulse is the ultimate RSI indicator — everything traders have been asking for in one lightweight, professional tool. It automatically detects Regular and Hidden divergences, shows a live Multi-Timeframe RSI panel, fills OB/OS zones for instant visual recognition, draws divergence lines on both the price chart and RSI subwindow, places Buy/Sell arrows, and provides real-time alerts. No more switching between 5 different RSI indicators.
Why Traders Choose RSI Divergence Pulse:
- COLOR-CODED RSI LINE
The RSI line changes color based on its current zone:
- Blue — Neutral zone (between 30 and 70), normal price action territory
- Green — Overbought zone (above 70), warning of overextension
- Red — Oversold zone (below 30), warning of extreme weakness
- RSI SIGNAL LINE
An SMA of RSI (default period 9) acts as a "signal line" — just like MACD's signal. Crossovers between RSI and Signal provide additional entry/exit timing. The difference (Diff) is shown in the dashboard.
- AUTOMATIC DIVERGENCE DETECTION
Fractal-based pivot algorithm scans up to 500 bars for:
- Regular (Actual) Divergence — Classic reversal signals (price makes new extreme, RSI disagrees)
- Hidden Divergence — Powerful trend continuation signals during pullbacks
- DUAL DIVERGENCE LINES
Solid lines for Regular, dashed lines for Hidden, drawn simultaneously on the price chart AND the RSI subwindow for instant visual confirmation. 4 independent colors for Bull Regular, Bear Regular, Bull Hidden, Bear Hidden.
- MULTI-TIMEFRAME RSI PANEL
See RSI values across M5, M15, H1, H4 and D1 — all in one compact panel inside the indicator window. Each timeframe is color-coded by zone (green=bullish, red=overbought/bearish, blue=oversold). Find multi-timeframe confluence without opening extra charts.
- OB/OS ZONE FILLS
Overbought (70+) and Oversold (30−) zones are filled with subtle background colors — red tint above 70, blue tint below 30. See at a glance when RSI enters extreme territory.
- BUY/SELL ARROWS
Clear entry signals placed directly on the price chart at each divergence point. Color-coded to match the divergence type.
- SIGNAL LABELS
"ACTUAL ▲" for reversal setups, "Hidden ▼" for continuation — zero guesswork on divergence type.
- REAL-TIME DASHBOARD
Dark-theme info panel showing:
- Live RSI value (green above 50 / red below 50)
- Diff: RSI minus Signal (green = bullish momentum / red = bearish)
- Signal line value (orange)
- Current zone: OVERBOUGHT / BULLISH / BEARISH / OVERSOLD
- Trend assessment: STRONG BUY / BUY / SELL / STRONG SELL / NEUTRAL
- MULTI-CHANNEL ALERTS
Popup, Sound, Email, and Push Notification support. Alerts fire on confirmed divergence — never miss a high-probability setup.
- FULLY CUSTOMIZABLE
Independent colors for all 4 divergence types. Toggle everything on/off: arrows, labels, dashboard, MTF panel, zone fills. Adjust OB/OS/Middle levels to suit your strategy.
- WORKS EVERYWHERE
Any symbol (Forex, Stocks, Indices, Crypto, Commodities), any timeframe (M1 to MN).
- CLEAN & LIGHTWEIGHT
No DLLs, no external dependencies. All objects auto-cleaned on removal. Non-repainting confirmed signals.
═══════════════════════════════════════════════════════════
HOW IT WORKS
═══════════════════════════════════════════════════════════
The indicator calculates the standard RSI (default period 14) and adds a Signal line (SMA of RSI, default period 9). It uses a fractal-based pivot detection algorithm to identify significant RSI highs and lows. By comparing consecutive pivots against corresponding price action:
- Price Lower-Low + RSI Higher-Low → Regular Bullish Divergence (reversal up)
- Price Higher-High + RSI Lower-High → Regular Bearish Divergence (reversal down)
- Price Higher-Low + RSI Lower-Low → Hidden Bullish Divergence (trend continuation up)
- Price Lower-High + RSI Higher-High → Hidden Bearish Divergence (trend continuation down)
The RSI line color changes automatically by zone — green in overbought, blue in neutral, red in oversold — so you can see market conditions at a glance without checking values.
The Multi-Timeframe panel reads RSI from 5 timeframes simultaneously, color-coded by zone, giving you instant confluence across the timeframe spectrum without switching charts.
The dashboard provides a real-time summary: RSI value, Signal value, their difference, the current zone assessment, and a trend strength rating from STRONG BUY to STRONG SELL.
═══════════════════════════════════════════════════════════
INPUT PARAMETERS
═══════════════════════════════════════════════════════════
RSI Settings:
- RSI Period (default: 14)
- Signal MA Period (default: 9) — SMA smoothing for the signal line
- Applied Price (default: Close)
Levels:
- Overbought Level (default: 70)
- Middle Level (default: 50)
- Oversold Level (default: 30)
Divergence Detection:
- Pivot Strength — bars each side for pivot confirmation (default: 5)
- Max Lookback Bars — how far back to scan (default: 500)
- Show Regular Divergence (default: true)
- Show Hidden Divergence (default: true)
Visual Style:
- 4 independent colors for Bull Regular, Bear Regular, Bull Hidden, Bear Hidden
- Divergence line width (1-5)
- Toggle: Arrows, Labels, Dashboard, OB/OS Zone Fill, MTF Panel
Alerts:
- Popup Alert (default: off)
- Sound Alert (default: off)
- Email Notification (default: off)
- Push Notification (default: off)
═══════════════════════════════════════════════════════════
TRADING TIPS
═══════════════════════════════════════════════════════════
- Regular divergence is strongest when RSI is deep in OB/OS zones (above 70 or below 30).
- Hidden divergence works best in clear trends — use it for pullback entries.
- Watch RSI color changes — green-to-blue (dropping out of OB) or red-to-blue (rising out of OS) are early warnings.
- Use the MTF panel for confluence: if H4 RSI is oversold AND H1 shows bullish divergence = high-probability long.
- Combine with support/resistance levels for highest probability entries.
- Don't fight the higher-timeframe RSI direction shown in the MTF panel.
- Multi-TF approach: confirm trend on H4/D1 via the MTF panel, find entries on H1/M15 via divergence signals.
- Zone fills make it instantly clear when RSI enters extreme territory — prepare for reversal signals.
- RSI/Signal crossover (Diff turning positive/negative) serves as a secondary confirmation signal.
- Use higher timeframes (H1+) for more reliable divergence signals with fewer false positives.
- Consider using 80/20 levels for strongly trending markets and 70/30 for range-bound conditions.
═══════════════════════════════════════════════════════════
WHAT MAKES THIS DIFFERENT FROM OTHER RSI INDICATORS
═══════════════════════════════════════════════════════════
Most RSI indicators on the market offer only ONE feature:
- Basic RSI line with no divergence
- Divergence detection but no alerts
- Multi-timeframe scanner but no divergence
- Dashboard but no visual signals on chart
RSI Divergence Pulse combines ALL of these into ONE professional tool:
- Color-Coded RSI Line (blue/green/red by zone)
- RSI Signal Line with crossover confirmation
- Regular + Hidden Divergence Detection
- Multi-Timeframe RSI Panel (M5, M15, H1, H4, D1)
- OB/OS Zone Fills with background coloring
- Buy/Sell Arrows + Signal Labels on Chart
- Live Dashboard with Zone + Trend Assessment
- Full Alert System (Popup, Sound, Email, Push)
- Non-repainting, lightweight, zero dependencies
═══════════════════════════════════════════════════════════
ALERTS
═══════════════════════════════════════════════════════════
Enable any combination of alert types:
- MetaTrader Popup Dialog
- Sound Alert (alert2.wav)
- Email (requires SMTP configuration in MetaTrader)
- Push Notification (requires MetaTrader mobile app + MetaQuotes ID)
Alerts fire ONCE per confirmed divergence signal — no spam, no repeated alerts.
═══════════════════════════════════════════════════════════
COMPATIBILITY
═══════════════════════════════════════════════════════════
- MetaTrader 5 (MT5) — included
- MetaTrader 4 (MT4) — separate version available
- Any broker, any symbol, any timeframe
- No DLLs required
═══════════════════════════════════════════════════════════
RECOMMENDED SETTINGS BY TIMEFRAME
═══════════════════════════════════════════════════════════
Timeframe Pivot Strength Max Lookback RSI Period Notes
M1 - M15 2 - 3 300 14 Fast signals, more noise
M30 - H1 4 - 5 500 14 Balanced (default)
H4 - Daily 5 - 8 500 14 Reliable, fewer signals
Weekly+ 8 - 10 300 14 Major moves only
═══════════════════════════════════════════════════════════
WHAT YOU GET
═══════════════════════════════════════════════════════════
- A professional RSI indicator that does the divergence analysis for you
- Clear visual signals — no subjective interpretation needed
- Multi-Timeframe context without opening additional charts
- Real-time zone + trend dashboard at a glance
- Instant notifications on your phone/email
- Works across all markets and timeframes
Stop manually scanning for divergences and switching between charts. Let RSI Divergence Pulse do the work while you focus on executing high-probability trades.
安全须知
本产品仅通过 MQL5.com 官方渠道获取。其他渠道版本可能缺少完整功能和技术支持。
EA 配置
| 交易品种 | XAUUSD |
| 时间框架 | H1 (推荐) |
| 推荐经纪商 | IC Markets, IC Trading |
| 最低存款 | $300 / 0.01手 |
📸 截图预览