📝 产品详情
Adaptive Trend Lines
| 作者 | Henri Salvatore Bigatti |
| 版本 | v2.5 |
| 更新 | 2021-07-30T23:03:50 |
| 激活数 | 0 |
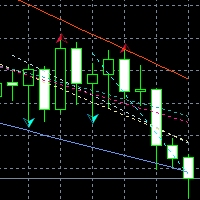
This indicator shows the TLH and TLL and some trendlines that allow us to estimate the trend of market.
It also shows the values of the angles of the lines in percentage in points (pip), the standard deviation, and the trend of each line, and when it breaks the lines of support and resistance (TLH and TLL).
And finally, it also shows the points identified as supports and resistances through the fractal algorithm in the graph.
The high and low trend lines are supported by the highs and lows, through fractals, but they will not always use only the highest and lowest points, because in addition to seeking to be supported by the maximum and minimum points, the algorithm implemented here draws lines of coherent trends (as parallel as possible) to the median line that expresses the main trendline of the period's prices, and which is shown in the graph as a central dashed line.
Help for labels:
TLR is Trendline Linear Regression
TLH is the Trend Line High
TLL is the Trend Line Lower
angle α is the angle of line
accel δ is the acceleration of tlr
stddev σ is the standard deviation of tlr
Please leave your rating and comment!!!
安全须知
本产品仅通过 MQL5.com 官方渠道获取。其他渠道版本可能缺少完整功能和技术支持。
EA 配置
| 交易品种 | XAUUSD |
| 时间框架 | H1 (推荐) |
| 推荐经纪商 | IC Markets, IC Trading |
| 最低存款 | $300 / 0.01手 |
📸 截图预览