📝 产品详情
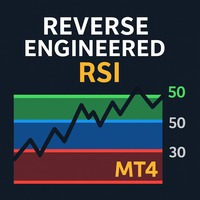
Reverse Engineered RSI MT4
| 作者 | Mario Jemic |
| 版本 | v1 |
| 更新 | 23 十二月 2025 |
| 激活数 | 5 |
| 原价 | $30 USD |
Reverse Engineered RSI
Introduction
Reverse Engineered RSI transforms the way traders use the RSI indicator.
Instead of displaying RSI in a separate oscillator window, this tool projects the key RSI levels — 30, 50, and 70 — directly onto the price chart.
This allows traders to see where overbought, oversold, and equilibrium zones align with actual price levels — without switching charts or guessing momentum conditions.
You get precise RSI-derived support and resistance levels right on the candle chart.
If you ever wanted to know exactly where RSI 30 or RSI 70 sits on price, now you can.
Why Reverse Engineer RSI Onto Price?Traditional RSI has one major drawback:
? It hides momentum levels off-chart, forcing traders to mentally map RSI movements back onto price.
Reverse Engineered RSI solves this by mathematically calculating:
✔ the exact price at which RSI would equal 30
✔ the exact price at which RSI would equal 50
✔ the exact price at which RSI would equal 70
These values are then projected as real-time dynamic lines.
No guessing.
No switching windows.
No lost momentum data.
1. RSI Support & Resistance (directly on price!)
The projected RSI levels act as:
-
dynamic support
-
dynamic resistance
-
turning zones
-
exhaustion areas
Price often reacts precisely at these RSI-projected boundaries — because they represent the market’s underlying momentum thresholds.
2. One Chart, All Information
No more bouncing between:
-
the main chart
-
the RSI window below
All RSI levels are integrated into price action itself.
This makes your analysis cleaner, faster, and more intuitive.
3. Spot Reversals Earlier
As price approaches:
-
RSI 30 projection → oversold zone
-
RSI 70 projection → overbought zone
-
RSI 50 → equilibrium / trend confirmation zone
Traders can visually see:
✔ where momentum shifts
✔ where reversals are likely
✔ where price is stretched or balanced
All without leaving the main chart.
4. Perfect For Price Action Traders
Reverse Engineered RSI unifies:
-
momentum logic
-
price-action structure
RSI becomes an active part of your chart — not a hidden oscillator.
Key Advantages✔ Works on all instruments: Forex, indices, crypto, metals, stocks
✔ Works on all timeframes
✔ Does not repaint
✔ Very lightweight — does not slow down MT4
✔ Perfect for trend trading, reversals, breakouts, scalping
✔ Excellent for confluence with S/R, moving averages, fractals, and more
1. Bounce Trading
Price touches RSI 30 line → look for bullish reversal setups.
Price touches RSI 70 line → watch for bearish exhaustion.
2. Breakout Confirmation
A clean break above/below the RSI 50 projection often signals:
-
trend continuation
-
shift in momentum
-
strong directional bias
3. Momentum-Based Channels
The RSI 30–50–70 projections create a natural “momentum corridor” around price.
4. Targets & Stops
Use RSI-projected levels as:
-
profit targets
-
stop placement zones
-
exhaustion markers
Reverse Engineered RSI (MT4) lets you see RSI directly on price, giving you:
-
clearer structure
-
earlier signals
-
stronger confluence
-
faster execution
It turns hidden momentum data into visible, tradable price levels.
If you want exact RSI zones mapped to actual market prices, this indicator gives you an edge no regular RSI can provide.
安全须知
本产品仅通过 MQL5.com 官方渠道获取。其他渠道版本可能缺少完整功能和技术支持。
EA 配置
| 交易品种 | XAUUSD |
| 时间框架 | H1 (推荐) |
| 推荐经纪商 | IC Markets, IC Trading |
| 最低存款 | $300 / 0.01手 |
📸 截图预览