📝 产品详情
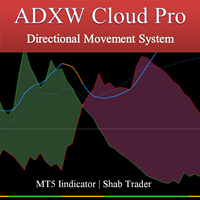
ADXW Cloud Pro
| 作者 | Shahabeddin Baset |
| 版本 | v1.3 |
| 更新 | 2024-02-14T14:11:51 |
| 激活数 | 10 |
| 原价 | $30 USD |
Full implementation of Directional Movement System for trading, originally developed by Welles Wilder, with modifications to improve profitability, to reduce the number of unfavorable signals, and with Stop Loss lines.
Features
- Buy/sell signals displayed on the chart
- Stop levels visually indicated on the chart
- Profit-taking points presented in the indicator window
- Exit points for unfavorable positions presented in the indicator window
- Signal confirmation through high/low swing crossings
- Fully customizable objects and graphical factors through input settings
- ADX indicator displayed in a cloud format with transparent colors
- Color-coded lines for easy signal identification
- Includes a gauge for identifying trend and range areas
- Applicable to all markets and time-frames
What Is ADX
J. Welles Wilder Jr., the developer of well-known indicators such as RSI, ATR, and Parabolic SAR, believed that the Directional Movement System, which is partially implemented in ADX indicator, was his most satisfying achievement. In his 1978 book, New Concepts in Technical Trading Systems, He said:
The core idea of this indicator is to record directional movements whenever there is a higher high or lower low. The indicator then calculates the smoothed moving average of these directional movements to determine the Directional Indexes (DIs), which are represented as DI+ and DI- lines within the ADX indicator (or as cloud in this version). The Average Directional Index (ADX) line is derived by dividing the difference between the DIs by their sum total.
Five rules for trading with Directional Movement System:
- When DI lines cross each other (equilibrium points in the indicator), it’s time to enter a position in the direction of their cross (green point for long position, red point for short position), but after checking other things (rules 2 & 3).
- When you observe an equilibrium point (EP) in the indicator, the high/low price of that candle becomes your extreme point (high in case of a green EP, and low in case of a red EP). Closing above the extreme point after green EP (and below extreme point after red EP) signals entry into a position in the direction of the EP, but it would be better to check other things (rule 3).
- (a) Do not trade when ADX line is below the cloud; (b) Do not trade when ADXR line is below the level (20, by default); (c) Do not trade when ADX line is moving downward. Because these are the three signs of the range market.
- Take profit when the color of the ADX line changes from blue to orange; this is probably a point of reversal. You may consider re-entering in the direction of your previous position if the ADX line color changes back to blue and remains above the cloud.
- Exit your current position when the ADX line dips below the cloud, and await another signal before considering re-entry.
I would be grateful if you let me know about any bugs or any suggestion to improve the code.
Related topics:
Average Directional Index, Directional Movement, DI+, DI-, trading system, ATR, reversal points, extremum point, equilibrium point, momentum, swing, stop levels
安全须知
本产品仅通过 MQL5.com 官方渠道获取。其他渠道版本可能缺少完整功能和技术支持。
EA 配置
| 交易品种 | XAUUSD |
| 时间框架 | H1 (推荐) |
| 推荐经纪商 | IC Markets, IC Trading |
| 最低存款 | $300 / 0.01手 |
📸 截图预览