📝 产品详情
FlatBreakoutPro
| 作者 | Aleksei Vorontsov |
| 版本 | v8 |
| 更新 | 27 六月 2025 |
| 激活数 | 10 |
| 原价 | $30 USD |
FlatBreakoutPro
Multi-Symbol Flat (Range) Panel & Breakout Detector for MT4
FlatBreakoutPro is a professional tool for modern traders that detects and tracks flat/range (consolidation) zones and helps you react instantly to breakouts across multiple symbols and timeframes. The indicator uses transparent fractal-based logic, delivers clear non-repainting signals, and provides full visual control of market conditions.
Who This Product Is For
Active traders who prefer trading range breakouts (breakout, flat breakout, volatility expansion).
Scalpers, intraday, and swing traders working with multiple instruments and timeframes.
Anyone who values automation, professional visualization, and market control “from a single panel.”
Key Advantages
Unique fractal logic: the flat zone is defined by three key fractals — one local low and two highs — which eliminates random and “stretched” ranges.
Multi-symbol & multi-timeframe panel: see all active flats and breakouts across selected assets and timeframes — instantly, clearly, in one place.
Accurate and timely alerts: you won’t miss a significant breakout — the signal is triggered right after the first candle closes outside the range.
Interactive chart control: click a panel cell and the chart instantly switches to the selected symbol and timeframe.
Flexible visualization and settings: colors, style, transparency, panel position, and analysis depth — everything is adjustable in a few clicks.
Non-repainting algorithm: all ranges and signals strictly match historical data — no “redrawing” in hindsight.
Easy integration and minimal terminal resource usage.
Indicator Logic & Workflow
1) Flat Zone Formation
The indicator analyzes historical data over a user-defined period (FB_LookbackBars).
It detects a fractal low (FL, blue) — a local low within the lookback window.
Then it finds two nearest fractal highs:
-
U1 — the last fractal high to the left of FL
-
U2 — the first fractal high to the right of FL, within FB_MaxFractalDistancePips
The upper boundary of the flat is max(U1, U2), and the lower boundary is FL.
The flat is confirmed only if the range width does not exceed FB_MaxRangePips.
2) Breakout Signals (breakout alerts)
If a candle closes above max(U1, U2) — Breakout Up.
If a candle closes below FL — Breakout Down.
The breakout signal triggers once, remains active for FB_CancelBars bars, and then the panel returns to the current flat / no-signal state.
3) Multi-Symbol Analysis Panel
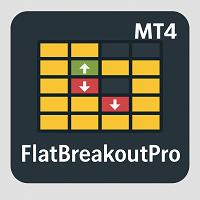
Each panel cell shows the status of one symbol on a specific timeframe:
-
Yellow: flat/range active
-
Green: breakout up
-
Red: breakout down
-
Gray: no signal / insufficient history
The panel is interactive: click = instant switch to the selected symbol and timeframe.
All data updates in real time, making it ideal for multi-asset trading.
4) Flat Cancellation Mechanism
A flat is considered canceled if more than N bars close outside the range (FB_CancelBars).
The range automatically updates as new extremes appear or volatility expands — only relevant flats are shown on the panel and chart.
Typical Use Cases
Automated monitoring of consolidations for breakout trading: find tight ranges and get notified when a new impulse begins.
Filtering false entries in trend and proprietary strategies: enter only after price exits a confirmed flat zone.
Fast watchlist overview: instantly see where a valid flat is forming and where the market is ready to move.
Trading journal and pattern analysis: all zones and signals are automatically marked on the chart.
Main Parameters & Settings
▶️ Multi-Symbol Analysis Panel
Symbols: comma-separated list (e.g., EURUSD,GBPUSD,XAUUSD).
Timeframes: comma-separated list (e.g., M5,H1,H4).
EnableAlerts: enable breakout alerts (true/false).
PanelCorner, panelX, panelY: panel position on the chart.
BackgroundColor, BackgroundOpacity, ShowPanelBackground: background color and transparency.
▶️ Fractal Flat Zone Parameters
FB_LookbackBars: analysis depth for fractal search (usually 20).
FB_MaxRangePips: maximum flat range width (in points/pips as defined by the indicator).
FB_MaxFractalDistancePips: maximum distance between U1/U2 fractals.
FB_CancelBars: breakout hold duration / flat cancel logic.
FB_BorderColor, FB_BorderWidth, FB_BorderStyle: range styling on the chart.
FAQ
— Can I use it on stocks, crypto, indices?
Yes. FlatBreakoutPro is universal and supports any MetaTrader 5 trading instruments.
— Do the signals or ranges repaint?
No. All ranges are built from closed bars and key extremes — no retrospective redrawing.
— Can I change parameters on the fly?
Yes. Settings apply instantly without restarting the terminal.
Getting Started
Install FlatBreakoutPro on any MT4 chart.
Set your Symbols and Timeframes (M5 and higher recommended).
Adjust flat detection sensitivity to match the instrument’s volatility and timeframe.
Monitor the panel and click a cell to open the required symbol/TF instantly.
FlatBreakoutPro is a reliable professional assistant for traders who value clear logic, instant signals, and modern visualization.
How to Test FlatBreakoutPro (including the demo) in MetaTrader Strategy Tester
1) MT4 Tester Limitations
MT4 Strategy Tester does not fully support real-time multi-symbol / multi-timeframe indicators. In tester mode, only the selected symbol and timeframe are available.
All data, objects, and signals will relate only to the tested symbol/TF.
2) Historical Data Preparation
Before testing, preload deep history for the symbol and required timeframes via Tools → History Center (F2).
Fractal and flat detection requires at least several hundred bars for each used timeframe.
3) What You Can Test
Flat algorithm behavior: watch how fractal ranges form during the test.
Breakout signal correctness: see when and where breakouts trigger.
Visualization: panel, flat rectangle, fractal markers, and color statuses.
4) Important Notes
The panel may display empty or outdated statuses for other symbols/timeframes — this is a tester limitation.
Alerts in tester mode appear only in the Journal (no standard sound/push notifications).
If no flat appears, you likely lack history or the parameters are too strict.
5) Get the Most Out of Testing
For quick checks, reduce the symbol/TF lists (e.g., only EURUSD, M15).
Set EnableAlerts=true to log breakout events in the Journal.
6) Step-by-Step Test Example
Preload history for EURUSD, GBPUSD, XAUUSD on M5, M15, H1 via F2.
Open Strategy Tester, choose any EA, set EURUSD and M15, enable Visualization.
In the visualization window, attach FlatBreakoutPro and set (Symbols="EURUSD", Timeframes="M15").
Run the test and observe panel behavior, flat formation, and breakout triggers.
Adjust speed, check alerts in the Journal, and switch settings for other scenarios.
安全须知
本产品仅通过 MQL5.com 官方渠道获取。其他渠道版本可能缺少完整功能和技术支持。
EA 配置
| 交易品种 | XAUUSD |
| 时间框架 | H1 (推荐) |
| 推荐经纪商 | IC Markets, IC Trading |
| 最低存款 | $300 / 0.01手 |
📸 截图预览