📝 产品详情
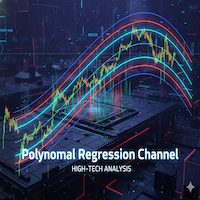
Polynomial Regression Channel MT4
| 作者 | Sathit Sukhirun |
| 版本 | v7 |
| 更新 | 29 一月 2026 |
| 激活数 | 20 |
| 原价 | $35 USD |
how each of these input fields is used and what happens on your chart when you adjust their values:
-
Custom text for comment:
- How to use: Type any text you want into the "Value" field.
- Result: The text you type will appear in the top-left corner of the chart window (known as the Chart Comment). You might use this for the indicator's name, version, or your own short notes.
-
Lookback period for regression calculation:
- How to use: Enter an integer (e.g., 100, 200, 300).
- Result: This determines how many past price bars the indicator will use to calculate the regression line.
- Smaller number: The line will adapt to recent price changes more quickly, suitable for observing short-term trends.
- Larger number: The line will be smoother, referencing more historical data, suitable for observing long-term trends.
-
Polynomial Degree (1-9):
- How to use: Enter an integer between 1 and 9.
- Result: This sets the curvature of the regression line.
- 1 : Straight line (Linear Regression).
- 2 : Parabolic curve.
- 3 (default): Cubic curve.
- Higher values allow the line to fit the price data more closely but can lead to overfitting.
-
Show the center regression line:
- How to use: Select true (show) or false (hide) from the drop-down list.
- Result:
- true : The central regression line will be displayed on the chart.
- false : The central regression line will be hidden (but the Standard Deviation Bands will still be visible if set to show).
-
Show future projection of the center line:
- How to use: Select true (show) or false (hide).
- Result:
- true : The central regression line will be drawn extending into the future (by the number of bars specified in the next input).
- false : The central regression line will end at the current bar.
-
Number of bars for future projection:
- How to use: Enter an integer (e.g., 20, 50, 100).
- Result: This determines how many bars into the future the projected center regression line (if enabled in point 5) will be drawn.
-
Multiplier for Standard Deviation Band 1:
-
Multiplier for Standard Deviation Band 2:
-
Multiplier for Standard Deviation Band 3:
- How to use: Enter a decimal number (e.g., 1.0, 1.618, 2.0, 2.618) for each band.
- Result: These numbers are multiplied by the Standard Deviation value to create the bands above and below the center regression line.
- Smaller value: Bands will be closer to the center line, making the channel narrower.
- Larger value: Bands will be further from the center line, making the channel wider.
-
Color for Center Line and SD1 Lines:
-
Color for SD2 Lines:
-
Color for SD3 Lines (Dark Red):
-
Color for Fill between SD1 and SD2 (Dark Blue):
-
Color for Fill between SD2 and SD3 (Dark Red):
- How to use: Click on the current color in the "Value" column, then choose a new color from the color palette that appears.
- Result:
- Item 10: Changes the color of the center regression line and the first pair of Standard Deviation Bands.
- Item 11: Changes the color of the second pair of Standard Deviation Bands.
- Item 12: Changes the color of the third pair of Standard Deviation Bands.
- Item 13: Changes the color of the filled area between Band 1 and Band 2.
- Item 14: Changes the color of the filled area between Band 2 and Band 3.
安全须知
本产品仅通过 MQL5.com 官方渠道获取。其他渠道版本可能缺少完整功能和技术支持。
EA 配置
| 交易品种 | XAUUSD |
| 时间框架 | H1 (推荐) |
| 推荐经纪商 | IC Markets, IC Trading |
| 最低存款 | $300 / 0.01手 |
📸 截图预览