📝 产品详情
Parabolic RSI for MT4
| 作者 | Minh Truong Pham |
| 版本 | v3 |
| 激活数 | 15 |
| 原价 | $43 USD |
⯁ KEY FEATURES
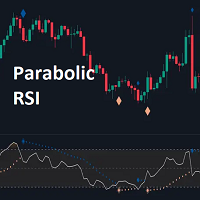
- Parabolic SAR Applied to RSI – Tracks momentum shifts within the RSI indicator.
- Dynamic SAR Dots – Plots SAR levels directly on the RSI for visual clarity.
Figure 1
- Threshold-Based Signal Filtering – Uses upper (70) and lower (30) RSI levels to determine strong signals.
- Simple and Strong Signal System:
Big Arrow (Strong Signals) – Appear when Parabolic SAR crosses above 70 or below 30 RSI, indicating potential reversals.
Normal Arrow (Regular Signals) – Appear when Parabolic SAR flips inside the RSI range, signaling weaker trend shifts.
Figure 2
- Chart Overlay Signals – Highlights strong RSI-based trend shifts directly on the price chart.
- Fully Customizable – Modify RSI length, SAR parameters, colors, and signal displays.
⯁ HOW TO USE
- Look for strong signals (big diamonds) when SAR flips above 70 RSI (overbought) or below 30 RSI (oversold) for potential reversals.
- Use regular signals (small diamonds) for minor trend shifts within the RSI range.
- Combine with price action and other indicators to confirm entry and exit points.
- Adjust the SAR acceleration factors to fine-tune sensitivity based on market conditions.
⯁ CONCLUSION
The Parabolic RSI indicator merges trend-following and momentum-based analysis by applying the Parabolic SAR to RSI. This allows traders to detect trend shifts inside the RSI space with an intuitive diamond-based signal system. Whether used alone or as part of a broader trading strategy, this indicator provides a clear and structured approach to identifying momentum reversals and potential trading opportunities.
安全须知
本产品仅通过 MQL5.com 官方渠道获取。其他渠道版本可能缺少完整功能和技术支持。
EA 配置
| 交易品种 | XAUUSD |
| 时间框架 | H1 (推荐) |
| 推荐经纪商 | IC Markets, IC Trading |
| 最低存款 | $300 / 0.01手 |
📸 截图预览