📝 产品详情
Top and bottom tracker
| 作者 | Maicon Pinheiro Dos Santos |
| 版本 | v6 |
| 激活数 | 10 |
| 原价 | $50 USD |
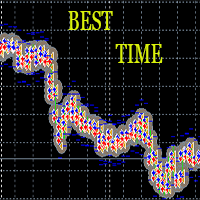
One of the advantages of the Arrow Tracker indicator is its vivid visual representation:
- Histogram Display: Situated beneath the main price chart, the indicator showcases a histogram. This allows for easy identification of market trends.
- Color-Coded Bars: Uptrends are demarcated with blue bars, whereas downtrends are depicted with pink bars. This differentiation assists traders in swiftly gauging the market’s directional momentum.
- Signalling Peaks and Bottoms: The histogram employs yellow bars to signify lows and peaks. Coupled with these are pink arrows (indicative of sell signals) and blue arrows (signifying buy signals). This dual representation — bars and arrows — provides traders with a clearer perspective on potential trading opportunities.
- Signalling Peaks and Bottoms: The histogram employs yellow bars to signify lows and peaks. Coupled with these are pink arrows (indicative of sell signals) and blue arrows (signifying buy signals). This dual representation — bars and arrows — provides traders with a clearer perspective on potential trading opportunities.
安全须知
本产品仅通过 MQL5.com 官方渠道获取。其他渠道版本可能缺少完整功能和技术支持。
EA 配置
| 交易品种 | XAUUSD |
| 时间框架 | H1 (推荐) |
| 推荐经纪商 | IC Markets, IC Trading |
| 最低存款 | $300 / 0.01手 |
📸 截图预览