📝 产品详情
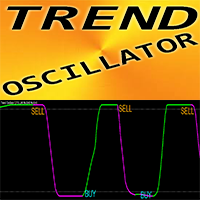
Two indicator
| 作者 | George Njau Ngugi |
| 版本 | v4 |
| 激活数 | 5 |
| 原价 | $50 USD |
1. Trend-Following Strategy
Objective: Enter trades in the direction of the trend when the Net Score and Signal Line confirm a strong trend.
- Look at the Net Score in the separate window:
- If the Net Score is above 0 and rising, the trend is bullish.
- If the Net Score is below 0 and falling, the trend is bearish.
- Confirm with the LazyLine on the main chart:
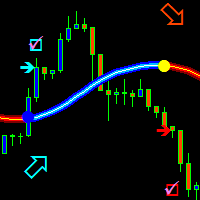
- Green LazyLine indicates an uptrend.
- Red LazyLine indicates a downtrend.
- Buy (Long):
- Net Score crosses above the Signal Line and is above 0.
- Net Score is approaching or above the upperLevel (75), indicating strong bullish momentum.
- LazyLine is green and sloping upward.
- Enter on a pullback to the LazyLine (acting as dynamic support) or on a breakout above recent highs.
- Sell (Short):
- Net Score crosses below the Signal Line and is below 0.
- Net Score is approaching or below the lowerLevel (-75), indicating strong bearish momentum.
- LazyLine is red and sloping downward.
- Enter on a pullback to the LazyLine (acting as dynamic resistance) or on a breakdown below recent lows.
- Place a stop loss below the recent swing low (for long trades) or above the recent swing high (for short trades).
- Alternatively, use the LazyLine as a trailing stop: exit if the price closes below the LazyLine (for longs) or above it (for shorts).
- Target a key resistance/support level on the chart.
- Alternatively, exit when the Net Score approaches extreme levels (e.g., above 75 for longs, below -75 for shorts) and starts to flatten or reverse.
2. Reversal Strategy
Objective: Trade potential reversals when the Net Score reaches extreme levels and shows signs of turning.
Steps:
- Identify Overbought/Oversold Conditions:
- Net Score above upperLevel (75) indicates a potential overbought condition (bearish reversal possible).
- Net Score below lowerLevel (-75) indicates a potential oversold condition (bullish reversal possible).
- Look for Divergence:
- Check for divergence between the Net Score and price:
- If the price makes a higher high but the Net Score makes a lower high, it’s a bearish divergence (potential reversal down).
- If the price makes a lower low but the Net Score makes a higher low, it’s a bullish divergence (potential reversal up).
- Check for divergence between the Net Score and price:
- Entry:
- Buy (Long):
- Net Score is below -75, but starts to rise and crosses above the Signal Line.
- LazyLine is red but flattens or starts to turn green.
- Enter on a bullish price action signal (e.g., a hammer or bullish engulfing candle) near a support level.
- Sell (Short):
- Net Score is above 75, but starts to fall and crosses below the Signal Line.
- LazyLine is green but flattens or starts to turn red.
- Enter on a bearish price action signal (e.g., a shooting star or bearish engulfing candle) near a resistance level.
- Buy (Long):
- Stop Loss:
- Place a stop loss above the recent swing high (for shorts) or below the recent swing low (for longs).
- Take Profit:
- Target the 0 level of the Net Score (neutral zone) or a key support/resistance level.
- Alternatively, exit when the Net Score crosses the 0 level or when the LazyLine changes color.
安全须知
本产品仅通过 MQL5.com 官方渠道获取。其他渠道版本可能缺少完整功能和技术支持。
EA 配置
| 交易品种 | XAUUSD |
| 时间框架 | H1 (推荐) |
| 推荐经纪商 | IC Markets, IC Trading |
| 最低存款 | $300 / 0.01手 |
📸 截图预览