📝 产品详情
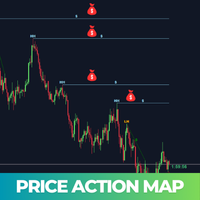
Price Action Map
| 作者 | Suvashish Halder |
| 版本 | v13 |
| 更新 | 16 三月 2025 |
| 激活数 | 10 |
| 原价 | $50 USD |
Price Action Map is an advanced trading indicator meticulously designed to provide clear visual insights into market structure by precisely labeling Higher Highs (HH), Higher Lows (HL), Lower Highs (LH), and Lower Lows (LL). Traders who find it challenging to accurately identify higher highs, lower lows, or understand different market phases will find this tool exceptionally valuable. Price Action Map significantly simplifies the analysis process, enabling traders at all skill levels to confidently determine the market's current state.
In addition, the indicator highlights critical liquidity levels with a distinct '$' symbol, making it easier to spot zones where liquidity accumulation and distribution are likely to occur. By clearly marking these essential areas, traders can more effectively anticipate potential market movements, leading to improved trading decisions and increased profitability. Whether you're a novice struggling to grasp market structure or an experienced trader seeking precision, Price Action Map empowers you to learn faster and earn consistently.
Key Features:
-
Market Structure Identification:
- Clearly marks HH, HL, LH, LL, making it effortless to recognize trends and reversals.
- Differentiates valid market structures clearly, enhancing trading decisions.
-
Liquidity Level Detection:
- Highlights liquidity zones with a unique '$' sign.
- Clearly shows sweeps or breached liquidity with an 'X', indicating invalidated zones.
-
Multiple Time Frame (MTF) Capability:
- Easily analyze price action across different timeframes simultaneously.
- Customize visibility according to user-defined timeframes for deeper market analysis.
-
Configurable Display Settings:
- Choose between displaying only current, valid price action labels and lines or also show historical invalidated labels and structures.
- Offers flexibility to declutter or enrich your charting experience based on trading style.
-
Enhanced Visualization:
- Fully customizable label colors, line colors, and text size.
- Distinct color coding for easy and rapid interpretation.
Customization and User Control:
- Set "Show Invalid Lines" and "Show Invalid HH/LL/HL/LH" to true or false based on preferred analysis clarity.
- Easy adjustments through a detailed, user-friendly settings panel.
- Immediate visual feedback, simplifying trading analysis.
Price Action Map is the ideal choice for traders seeking precision, clarity, and actionable insights into the nuanced dynamics of price movements, liquidity levels, and market structure. Enhance your trading approach with structured, clear, and concise visual analysis.
安全须知
本产品仅通过 MQL5.com 官方渠道获取。其他渠道版本可能缺少完整功能和技术支持。
EA 配置
| 交易品种 | XAUUSD |
| 时间框架 | H1 (推荐) |
| 推荐经纪商 | IC Markets, IC Trading |
| 最低存款 | $300 / 0.01手 |
📸 截图预览