📝 产品详情
Multiple Non Linear Regression MT4
| 作者 | Cao Minh Quang |
| 版本 | v1.2 |
| 更新 | 2025-02-06T07:49:46 |
| 激活数 | 5 |
| 原价 | $49 USD |
Multiple Non-Linear Regression MT4
This indicator is designed to perform multiple non-linear regression analysis using four independent variables: close, open, high, and low prices.
Here's a components and functionalities:
Inputs:
- Normalization Data Length: Length of data used for normalization.
- Learning Rate: Rate at which the algorithm learns from errors.
- Show data points: Show plotting of normalized input data(close, open, high, low)
- Smooth?: Option to smooth the output.
- Smooth Length: Length of smoothing if enabled.
- Define start coefficients: Initial coefficients for the regression equation.
Data Normalization:
The script normalizes input data to a range between 0 and 1 using the highest and lowest values within a specified length.
Non-linear Regression:
It calculates the regression equation using the input coefficients and normalized data. The equation used is a weighted sum of the independent variables, with coefficients adjusted iteratively using gradient descent to minimize errors.
Error Calculation:
The script computes the error between the actual and predicted values.
Gradient Descent:
The coefficients are updated iteratively using gradient descent to minimize the error.
Visualization:
- Plotting of normalized input data (close, open, high, low).
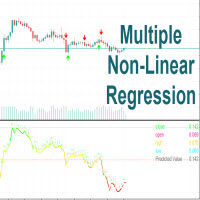
- The indicator provides visualization of normalized data values (close, open, high, low) in the form of circular markers on the chart, allowing users to easily observe the relative positions of these values in relation to each other and the regression line.
- Plotting of the regression line.
- Color gradient on the regression line based on its value and bar colors.
- Display of normalized input data and predicted value in a table.
- Signals for crossovers with a midline (0.5).
Interpretation:
Users can interpret the regression line and its crossovers with the midline (0.5) as signals for potential buy or sell opportunities.
This indicator helps users analyze the relationship between multiple variables and make trading decisions based on the regression analysis. Adjusting the coefficients and parameters can fine-tune the model's performance according to specific market conditions.
安全须知
本产品仅通过 MQL5.com 官方渠道获取。其他渠道版本可能缺少完整功能和技术支持。
EA 配置
| 交易品种 | XAUUSD |
| 时间框架 | H1 (推荐) |
| 推荐经纪商 | IC Markets, IC Trading |
| 最低存款 | $300 / 0.01手 |
📸 截图预览