📝 产品详情
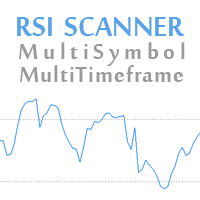
RSI Scanner MT5
| 作者 | Amir Atif |
| 版本 | v2.0 |
| 更新 | 2022-04-19T23:16:16 |
| 激活数 | 15 |
| 原价 | $40 USD |
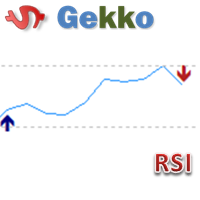
RSI Scanner is a multi symbol multi timeframe RSI dashboard that monitors Relative Strength Index indicator for price entering and exiting overbought and oversold in up to 28 symbols and 9 timeframes.
RSI Scanner features:
- Signals RSI entering and exiting the overbought and oversold zones.
- Monitors 28 customizable instruments and 9 timeframes at the same time.
- Supports all 21 timeframes of Metatrader 5 platform.
- You can choose between 3 alert modes:
- Single symbol and timeframe
- Multiple timeframes of a symbol
- Multiple symbols for a timeframe
- Popup, email, and phone notification alerts for selected symbols and timeframes.
- Quick review of signals in the same chart by clicking on signal buttons.
- Works on any instrument like currencies, cryptos, stock CFDs etc.
Notes
- The dashboard displays four signals in four colors. Light blue and light red for price entering the oversold or overbought zone, deep blue, and deep red are for RSI exiting the oversold or overbought zone.
- If you want to monitor more than 28 instruments you can load the indicator on another chart with different "Unique ID" in the settings and set different symbols for it.
- The symbols that you want to add to the dashboard must be visible in the MetaTrader market watch window. The first time you run the indicator or load a new symbol in the dashboard it might take a few seconds to update its data and show signals.
安全须知
本产品仅通过 MQL5.com 官方渠道获取。其他渠道版本可能缺少完整功能和技术支持。
EA 配置
| 交易品种 | XAUUSD |
| 时间框架 | H1 (推荐) |
| 推荐经纪商 | IC Markets, IC Trading |
| 最低存款 | $300 / 0.01手 |
📸 截图预览