📝 产品详情
MarketPrice Indicator
| 作者 | Martin Alejandro Bamonte |
| 版本 | v4 |
| 激活数 | 5 |
| 原价 | $30 USD |
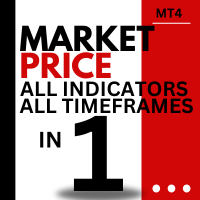
The MarketPrice Indicator is designed to provide a quick, one-glance visualization of the trend direction for a currency pair across all time frames (Time Frames), streamlining decision-making.
MarketPrice Indicator is based on daily levels and trading signals derived from moving average crossovers and market strength according to various technical indicators. It comes fully configured, though you can, of course, modify any parameters as desired.
Indicator Logic
The indicator uses a combination of moving averages, RSI, CCI, and Stochastic to assess trend strength and generate buy and sell signals. Below is a detailed description of the logic:
-
Moving Averages:
- The indicator uses two sets of moving averages:
- One set to detect quick crossovers with configurable periods ( MAFast_Period and MASlow_Period ).
- Another set to identify the general trend with slower moving averages ( TMAFast_Period and TMASlow_Period ).
- Signals are generated by comparing the moving averages:
- Buy Signal: When the fast moving average (MAFast or TMAFast) crosses above the slow moving average (MASlow or TMASlow).
- Sell Signal: When the fast moving average crosses below the slow moving average.
-
Strength Indicators:
- The indicator also uses a combination of technical indicators to measure trend strength:
- RSI (Relative Strength Index) with a configurable period ( RSI_Period ). Values above 50 indicate bullish strength, while values below 50 indicate bearish strength.
- CCI (Commodity Channel Index) to identify overbought or oversold conditions. Positive values suggest a bullish impulse, while negative values indicate a bearish impulse.
- Stochastic to measure market momentum, configurable with the parameters STOCH_K_Period , STOCH_D_Period , and STOCH_Slowing .
-
Visualization and Visual Signals:
- The indicator uses a custom color palette to represent important levels and market states:
- Green for bullish conditions (prices rising).
- Red for bearish conditions (prices falling).
- Other colors, such as DarkGreen , OrangeRed , and Peru , highlight distances from highs and lows and daily price differences.
- Buy and sell signals are visually represented with specific symbols:
- Green arrow for a bullish signal (indicating a buying opportunity).
- Red arrow for a bearish signal (indicating a selling opportunity).
- White square for a neutral condition (no buy or sell recommendation).
How to Take Trades
To take a trade using this indicator, follow the logic of the generated signals:
-
Buy Signal: When these conditions are met, the indicator displays a green arrow, indicating a buy signal:
- RSI is above 50.
- CCI is positive.
- Stochastic is above 40.
- The fast moving average crosses above the slow moving average.
- The closing price of the current candle is higher than its opening price (bullish candle).
-
Sell Signal: When these conditions are met, the indicator displays a red arrow, indicating a sell signal:
- RSI is below 50.
- CCI is negative.
- Stochastic is below 60.
- The fast moving average crosses below the slow moving average.
- The closing price of the current candle is lower than its opening price (bearish candle).
-
Neutral Conditions:
- Situations where signals are contradictory (e.g., RSI below 50 but Stochastic above 40) are represented by a white square, indicating an area of indecision.
Indicator Settings
Below are the default configurations for each technical indicator used in the MarketPrice Indicator :
-
Moving Averages for Fast and Slow Crossovers:
- MAFast_Period : 1
- MAFast_Method : Simple Moving Average (SMA)
- MASlow_Period : 4
- MASlow_Method : Simple Moving Average (SMA)
-
Moving Averages for Trend:
- TMAFast_Period : 1
- TMAFast_Method : Simple Moving Average (SMA)
- TMASlow_Period : 20
- TMASlow_Method : Simple Moving Average (SMA)
-
Strength Indicators:
- RSI:
- Period: 5
- Price Type: Close
- CCI:
- Period: 20
- Price Type: Close
- Stochastic:
- %K: 5
- %D: 3
- Slowing: 3
- Price Field: Close/Close
MarketPrice Indicator is a comprehensive tool for traders looking to quickly identify the trend across all time frames. With a single glance, you can determine the exact trend direction of a pair on each time frame, providing a quick and precise market overview.
安全须知
本产品仅通过 MQL5.com 官方渠道获取。其他渠道版本可能缺少完整功能和技术支持。
EA 配置
| 交易品种 | XAUUSD |
| 时间框架 | H1 (推荐) |
| 推荐经纪商 | IC Markets, IC Trading |
| 最低存款 | $300 / 0.01手 |
📸 截图预览