📝 产品详情
Market Volume Profile Modes
| 作者 | Zhen Yu Zheng |
| 版本 | v1.0 |
| 更新 | 2025-11-28T09:44:21 |
| 激活数 | 2 |
Overview
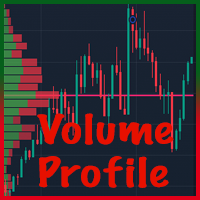
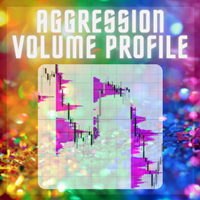
Market Volume Profile Modes is a powerful MT5 volume distribution indicator that integrates multiple Volume Profile variants. Users can switch between different analysis modes through a simple menu selection. This indicator helps traders identify key price levels, support and resistance zones, and market volume distribution.
Core Concepts
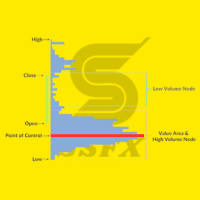
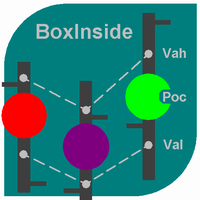
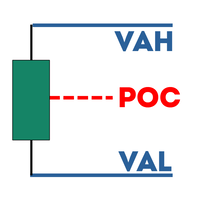
• POC (Point of Control): The price level with the highest volume concentration, representing the market's accepted "fair value" area
• VAH (Value Area High): Upper boundary of the value area, typically used as resistance reference
• VAL (Value Area Low): Lower boundary of the value area, typically used as support reference
• Value Area: The price range containing a specified percentage (default 70%) of total volume
Mode Descriptions
This indicator supports 8 different Volume Profile modes, suitable for various trading styles and analysis requirements:
| Mode Name | Description | Usage |
|---|---|---|
| Fixed Range (VPFR) | Manually drag rectangle to select any range | Click "+ Add Range" button to create rectangle, drag to adjust |
| Visible Range (VRVP) | Automatically calculate current visible chart range | Updates automatically with chart scrolling and zooming |
| Session (Daily) | Display separate Profile for each trading day | Auto-splits by date, shows daily volume distribution |
| Weekly | Display separate Profile for each week | Splits by week, suitable for weekly analysis |
| Monthly | Display separate Profile for each month | Splits by month, suitable for monthly analysis |
| Hourly | Display separate Profile for each hour | Suitable for intraday scalping traders |
| 4 Hour | Display separate Profile every 4 hours | Suitable for short to medium-term traders |
| Custom(N Bars) | Custom number of bars per period | Set via Custom Mode: Number of Bars parameter |
Parameter Settings
Below is a detailed description of all configurable parameters:
| Parameter Name | Description | Default Value |
|---|---|---|
| Volume Profile Mode | Select Profile calculation mode | Session (Daily) |
| Custom Mode: Number of Bars | Number of bars for custom mode | 20 |
| Max Profiles to Display | Maximum number of Profiles to show | 10 |
| Profile Position | Profile display position (Left/Right) | Left |
| Number of Rows | Number of Profile rows (precision) | 24 |
| Profile Width (%) | Profile width as percentage of period | 40.0 |
| Bar Gap (%) | Gap percentage between adjacent rows | 5.0 |
| Bullish Volume Color | Color for bullish volume | DodgerBlue |
| Bearish Volume Color | Color for bearish volume | HotPink |
| Show POC Line | Whether to display POC line | true |
| POC Color/Width/Style | POC line color, width, style | White / 2 / Solid |
| Show VAH Line | Whether to display Value Area High line | true |
| VAH Color/Width/Style | VAH line color, width, style | Red / 1 / Dot |
| Show VAL Line | Whether to display Value Area Low line | true |
| VAL Color/Width/Style | VAL line color, width, style | Lime / 1 / Dot |
| Value Area % | Value Area percentage | 70.0 |
| Range Rectangle Color | Rectangle color (Fixed Range mode) | Yellow |
| Range Rectangle Width | Rectangle line width | 1 |
| Range Rectangle Style | Rectangle line style | Dash |
| Show Session Divider | Whether to show period divider lines | true |
| Session Divider Color | Divider line color | Gray |
Usage Tutorial
Using Fixed Range Mode
- After adding the indicator to the chart, set Volume Profile Mode to "Fixed Range (VPFR)"
- "+ Add Range" and "Clear All" buttons will appear in the top-left corner
- Click "+ Add Range" button to create a yellow dashed rectangle in the visible chart area
- Drag the rectangle corners or edges to adjust the analysis range
- Volume Profile will automatically be drawn within the rectangle
- You can create multiple rectangles for multi-area analysis
- Click "Clear All" button to remove all rectangles and Profiles
Using Session/Weekly/Monthly Modes
- Select the corresponding mode (e.g., Session)
- The indicator will automatically split by time period and draw Profiles
- Control the display quantity via Max Profiles to Display parameter
- Gray dotted lines indicate period dividers (can be disabled via parameter)
Trading Applications
Support and Resistance Identification
- POC levels typically form strong support or resistance
- VAH and VAL form value area boundaries; price tends to oscillate within this range
- Low Volume Nodes (sparse volume areas) - price tends to move quickly through these zones
Entry Strategies
- Consider entering when price retests the POC
- Price breaking through VAH/VAL and retesting can serve as entry signals
- Confirm with other technical indicators (e.g., candlestick patterns, momentum indicators)
Stop Loss and Take Profit Settings
- Stop loss can be placed below VAL (long) or above VAH (short)
- Take profit can reference the next Volume Profile's POC or VA boundaries
安全须知
本产品仅通过 MQL5.com 官方渠道获取。其他渠道版本可能缺少完整功能和技术支持。
EA 配置
| 交易品种 | XAUUSD |
| 时间框架 | H1 (推荐) |
| 推荐经纪商 | IC Markets, IC Trading |
| 最低存款 | $300 / 0.01手 |
📸 截图预览