📝 产品详情
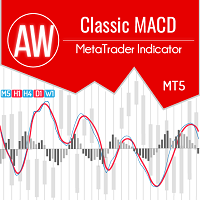
AW Classic MACD MT5
| 作者 | AW Trading Software Limited |
| 版本 | v2.10 |
| 更新 | 2021-04-27T21:10:54 |
| 激活数 | 0 |
Modified oscillator MACD. A classic indicator that combines a trend indicator with an oscillator to detect entry points. Has a multi-timeframe panel and 3 types of notifications
Benefits:
- Works on all instruments and timeseries
- Trend indicator with oscillator for inputs
- Multi-period panel on all timeframes
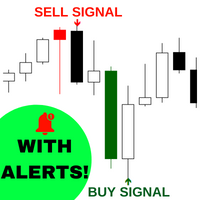
- Pluggable arrows when signals appear
- Three types of notifications: push, email, alert
How the indicator works:
AW Classic MACD - Indicator of moving convergence or divergence, consists of two moving averages and a histogram.
Moving average lines:
- The blue thin line is the main fast line- The red thick line is the signal, slow line
The indicator lines are displayed in a separate window, they are not located on the chart, moving averages move relative to zero, and not relative to current prices.
When two moving averages cross, a signal from the indicator will be received.
When the blue line is above the red one is an uptrend, the red line is above the blue one is a downtrend.
Bar graph:
- The size of the histogram increases - it means that the current trend is strengthening, while the histogram turns dark- The size of the histogram decreases - means the end of the current dynamics, the color of the histogram changes to a lighter
The histogram shows the ratio of the indicator lines to each other. The closer the lines are to each other, the shorter the histogram line. The further the indicator lines are from each other, the longer the line in the histogram.
- The histogram is above the "0" mark - an upward trend- The histogram below the "0" mark - a downtrend
Signals:
1. Zero Level:
- The blue line of the indicator crossed the "0" mark from bottom to top (that is, it was less than zero, and then became larger) - a buy signal- The blue line of the indicator crossed the "0" mark from top to bottom (was more than zero, and then dropped below zero) - a sell signal
2. Cross Lines:
- The main (blue) line crossed the signal (red) line from bottom to top - a buy signal- The main (blue) line crossed the signal (red) line from top to bottom - a sell signal
3. When the histogram is below the "0" mark - this is a downtrend, the histogram is above the "0" mark - an uptrend
Input settings:
MAIN SETTINGS
Fast ema period MACD - period of the fast (blue) moving average
Slow ema period MACD - period of the slow (red) moving average
Signal period MACD - Signal moving period, not displayed on the chart, used for calculations
Applied price MACD - The price used for indicator calculations
Max Bars - The maximum number of candles on which the indicator will be calculated
Signals Type - Adjust the display of signals
- Both Signals - Both types of signals
- Zero Level - Signals at zero crossing
- Cross Lines - Signals at the intersection of slow and fast moving averages
NOTIFICATIONS SETTINGS
Notification candle number - Select on which candle to display notifications (0 - the current candle, 1 - work at the closing prices, then work on the previous candle)
Send Push Notification - Use notifications of new signals to the mobile version of the trader's terminal
Send Pop Up Alert - Use pop-up notifications
Send Email - Use sending letters about the appearance of signals to the trader's e-mail
GRAPHICS SETTINGS
Multitimeframe dashboard - Panel display view, minimized or full
Font size in panel - Text size in the indicator panel
Y offset - move the multi-frame panel along the Y axis
X offset - move the multi-frame panel along the X axis
Uptrend Color Panel - Color of the upward direction in the panel
Downtrend Color Panel - Color of the downward direction in the panel
Up Color Main Panel - Color of the uptrend in the panel
Down Color Main Panel - Color of the downtrend in the panel
Buy Signal Color - Arrow color when a buy signal arrives
Sell Signal Color - Color of the arrow when a sell signal arrives
Support:
We are happy to provide our developments for free, but due to the limited time available, all free products are provided without any support.
Thank you for understanding.
安全须知
本产品仅通过 MQL5.com 官方渠道获取。其他渠道版本可能缺少完整功能和技术支持。
EA 配置
| 交易品种 | XAUUSD |
| 时间框架 | H1 (推荐) |
| 推荐经纪商 | IC Markets, IC Trading |
| 最低存款 | $300 / 0.01手 |
📸 截图预览