📝 产品详情
MN1 W1 D1 Close Price Indicator
| 作者 | Andras Salamon |
| 版本 | v3 |
| 激活数 | 5 |
| 原价 | $30 USD |
MN1-W1-D1 Close Price Indicator to Index Trading for MT4
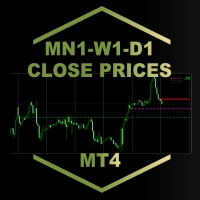
The indicator draws lines to the close prices of the last closed bars of monthly, weekly and daily timeframes. Observably, these prices are significant support and resistance prices at major indices, like Nasdaq, DAX.
The info panel always shows the prices relative to each other in the correct order. If the current price is the highest - i.e. higher than the last monthly, weekly and daily closing price - it is in the first row. The lowest price is always in the last, in the fourth line.
In the Info Panel, an Arrow indicates the abstract position of the current price related to the high timeframe prices, which the market often considers as support and resistance prices. If these prices or lines are broken, the opportunity for further price movement opens up. Especially when current price breaks all MN1, W1 and D1 prices.
- The arrow is Lime and Up if the current price is the highest.
- The arrow is Green and in Right up if the current price is lower than the D1 line but higher than the W1 and MN1 line. It is worth watching the price movement, because if the market price breaks the daily price, an intense upward movement is probable.
- The arrow is Orange and Right down when the current price is higher than the D1 line but lower than the W1 and MN1 line. It is worth watching the price movement because if the market price breaks down the daily price, an intense downward movement is likely.
- The arrow is Red and Down when the current price is the lowest.
Please watch video to see how market usually behaves at these prices.
[ MT5 version | All Products ]
安全须知
本产品仅通过 MQL5.com 官方渠道获取。其他渠道版本可能缺少完整功能和技术支持。
EA 配置
| 交易品种 | XAUUSD |
| 时间框架 | H1 (推荐) |
| 推荐经纪商 | IC Markets, IC Trading |
| 最低存款 | $300 / 0.01手 |
📸 截图预览