📝 产品详情
Dot Histogram Trend for Buy Sell
| 作者 | Do Thi Phuong Anh |
| 版本 | v13 |
| 激活数 | 5 |
| 原价 | $38 USD |
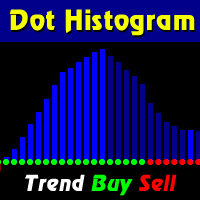
The Dot on Histogram Trend indicator is a straightforward tool in forex trading. When used in conjunction with other indicators, it can be highly rewarding.
The indicator consists of a blue and red histogram, representing positive and negative territories, respectively. Buy opportunities arise when the histogram is positive, while sell opportunities emerge when it's negative.
Signal Steps:
1. Dot at Zero Level:
- Green Dot: Indicates a clear uptrend; take action.
- Red Dot: Do nothing; maintain your position.
2. Action:
- Buy:
- Confirm Green Dot at level 0.
- Blue histogram.
- Set stop loss just below the recent swing low.
- Take profit as the indicator goes into negative territory.
- Sell:
- Confirm Green Dot at level 0.
- Red histogram.
- Set stop loss just above the recent high.
- Take profit as the indicator rises into the positive zone.
In summary, go long when there's a green dot on the zero line and blue histogram lines. Sell when there's a green dot on the zero line and red histogram lines.
This strategy is effective across various time frames but yields the best results on higher time frames like H4. Trading on H4 helps avoid market volatility and false signals.
安全须知
本产品仅通过 MQL5.com 官方渠道获取。其他渠道版本可能缺少完整功能和技术支持。
EA 配置
| 交易品种 | XAUUSD |
| 时间框架 | H1 (推荐) |
| 推荐经纪商 | IC Markets, IC Trading |
| 最低存款 | $300 / 0.01手 |
📸 截图预览