📝 产品详情
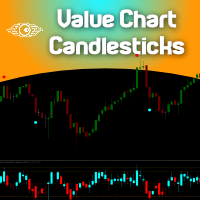
Value Chart Candlesticks
| 作者 | Flavio Javier Jarabeck |
| 版本 | v1.2 |
| 更新 | 2022-06-17T21:45:01 |
| 激活数 | 0 |
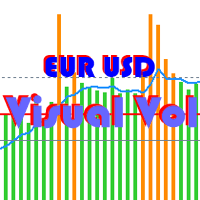
The idea of a Value Chart indicator was presented in the very good book I read back in 2020, "Dynamic Trading Indicators: Winning with Value Charts and Price Action Profile", from the authors Mark Helweg and David Stendahl. The idea is simple and the result is pure genius: Present candlestick Price analysis in a detrended way!
HOW TO READ THIS INDICATOR
- Look for Overbought and Oversold levels. Of course, you will need to test the settings a lot to find the "correct" one for your approach. It all depends on the Symbol you are studying and the timeframe also.
- Look for Divergencies, this indicator is powerful on this subject.
- Explore!
SETTINGS
- Period of analysis
- Light up candles that reache the maximum threshold?
- Overbought and Oversold levels
- Show dots on chart when the overbought and oversold levels are reached.
- Dot styles...
CHANGELOG
v 1.1 - Ability to control both Overbought/Oversold and Extreme Obverbought/Oversold levels according to your own assset.
Enjoy!
If you like this indicator, all I am asking is a little Review (not a Comment, but a REVIEW!)...
This will mean A LOT to me... And this way I can continue to give away Cool Stuff for Free...
With No Strings Attached! Ever!
Live Long and Prosper!
;)安全须知
本产品仅通过 MQL5.com 官方渠道获取。其他渠道版本可能缺少完整功能和技术支持。
EA 配置
| 交易品种 | XAUUSD |
| 时间框架 | H1 (推荐) |
| 推荐经纪商 | IC Markets, IC Trading |
| 最低存款 | $300 / 0.01手 |
📸 截图预览