📝 产品详情
PatternScannerMT4
| 作者 | Evgeniy Zhdan |
| 版本 | v10 |
| 激活数 | 5 |
| 原价 | $30 USD |
Candlestick pattern indicator - display found candlestick patterns on the chart.
MT5-version: https://www.mql5.com/en/market/product/103134
Bearish patterns:
| Bearish Pattern Designations | Pattern name |
|---|---|
| SS | Shooting Star |
| STR(S) | Evening Star |
| DJ(E) | Evening Doji Star |
| DC | Dark Cloud Veil |
| BEP | Bearish Engulfing |
Bullish patterns:
| Designation of bullish patterns | Pattern name |
|---|---|
| HMR | Hammer pattern |
| STR(M) | Morning Star |
| DJ(M) | Morning Doji Star |
| PRL | Piercing Line |
| BEP | Bullish Engulfing |
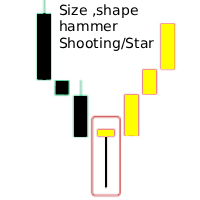
The Shooting Star pattern is a bearish reversal pattern consisting of just one candlestick. A shooting star forms when the price rises significantly and then corrects, leaving a long wick at the top of the candle. The long wick should be at least half the total length of the shooting star candle.
The Evening Star pattern consists of 3 Japanese candlesticks, the type of which is reversal (the first is light and long, the second is a small any color scheme, and the third is long and dark). Evening star reminds that the downward price movement has been replaced by an upward one. This model is considered a harbinger of price reduction.
The Evening Star Doji pattern , unlike the Evening Star , contains a doji candle (or as it is also called doji) in the figure. The doji candle in the pattern is located in the middle, that is, it is the second candle. Since dodge itself is a good signal, its presence in the model greatly enhances its signal.
The Dark Cloud Cover pattern is signaling that buying potential has been reduced to a minimum and there is little chance that the uptrend will continue.
The bearish engulfing pattern signals an upcoming price decline. The pattern consists of an ascending (white or green) candle followed by a large descending (black or red) candle that eclipses or "engulfs" a smaller ascending candle.
The Hammer pattern consists of one candle and is formed at the end of a bearish trend. That is, the meaning of this model is that the decline in the market ends and growth should begin soon.
The Morning Star pattern indicates a bullish mood in the market. Considered a reversal pattern that indicates an increase in price after a sustained downtrend.
The Morning 3 Star Doji formation may indicate a significant trend reversal. This pattern is seen as more significant than the typical morning star.
The Penetrating Line pattern is seen as a bullish reversal candlestick pattern located at the bottom of a downtrend. This figure is often followed by a trend reversal against the backdrop of bullish activity. This formation includes two candles: the second bullish candle opens lower than the previous bearish candle, and then buyers become active, pushing the price above 50% of the body of the bearish candle.
A Bullish Engulfing pattern is a white candle that closes above the previous candle's open after opening below the previous candle's close . This can be determined when a small black candle showing a bearish trend is followed by a large white candle showing a bullish trend, the body of which completely overlaps or engulfs the body of the previous candle.
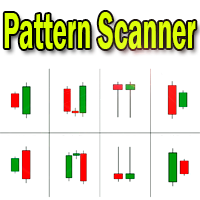
How some patterns of this indicator look like is shown in one of the screenshots.
安全须知
本产品仅通过 MQL5.com 官方渠道获取。其他渠道版本可能缺少完整功能和技术支持。
EA 配置
| 交易品种 | XAUUSD |
| 时间框架 | H1 (推荐) |
| 推荐经纪商 | IC Markets, IC Trading |
| 最低存款 | $300 / 0.01手 |
📸 截图预览