📝 产品详情
FindScientificTradePeriod
| 作者 | Aleksey Ivanov |
| 版本 | v5 |
| 激活数 | 5 |
| 原价 | $30 USD |
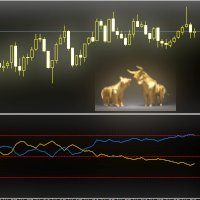
The indicator visualizes the result of the CalculateScientificTradePeriod script (which, of course, also needs to be downloaded), which, firstly, estimates how many Mx bars of the active chart the future trend will most likely continue and what is its quality, and, secondly, calculates the optimal the averaging period (which is also equal to Mx) of the ScientificTrade indicator, which gives the maximum profit according to the extremely effective ScientificTrade strategy.
On the horizontal (time for conventional indicators) axis of the FindScientificTradePeriod indicator, the averaging period "M" is plotted, and on the vertical axis, the forecast values of certain parameters calculated by the CalculateScientificTradePeriod script are plotted. By default, the CalculateScientificTradePeriod script predicts the trend quality indicator Q (which is described by the Quality trend indicator in real time and on the price history) on a set of future time periods starting with a length of 10 bars from the current bar into the future and ending with a length of 200 bars from the current bar of the corresponding timeframe , which forms the function Q(M) of the quality of the trend future trend at different time intervals. The optimal period Mx corresponds to the maximum Mx=max Q(M) of the trend quality function, which (maximum) is located according to the chart displayed by the FindScientificTradePeriod indicator. To determine the optimal period to the maximum of the function (to the red bar), you need to move the mouse cursor and the value of this period and the value of this function will be displayed in the tooltip. At the same time, you need to look for a smoothly drawn maximum without random beats of the displayed parameter, which are mainly characteristic of small intervals. The desired maximum value should be greater than 2.5.
Indicator settings.
- Spectrum of computed values M>10. The maximum calculated averaging period. Values: Any positive integer between 11 and 200. Default is 200.
安全须知
本产品仅通过 MQL5.com 官方渠道获取。其他渠道版本可能缺少完整功能和技术支持。
EA 配置
| 交易品种 | XAUUSD |
| 时间框架 | H1 (推荐) |
| 推荐经纪商 | IC Markets, IC Trading |
| 最低存款 | $300 / 0.01手 |
📸 截图预览