📝 产品详情
Bookmap pro
| 作者 | Ahmed Mohammed Bakr Bakr |
| 版本 | v1.0 |
| 激活数 | 2 |
Overview
The Bookmap Volume Heatmap is a custom MetaTrader 5 (MQL5) indicator that creates a visual heatmap of trading volume distribution across price levels, similar to professional trading platforms like Bookmap. It provides traders with a clear visualization of where significant trading activity has occurred within a specified price range.
Key Features
1. Volume Distribution Visualization
-
Creates color-coded rectangles on the chart representing volume intensity at different price levels
-
Uses a grid system with configurable number of price levels (default: 50)
-
Color gradient indicates volume intensity:
-
Dark Blue: Low volume (0-25%)
-
Blue: Medium volume (25-50%)
-
Yellow: High volume (50-75%)
-
Red: Maximum volume (75-100%)
-
2. Customizable Parameters
-
GridLevels: Number of price levels to analyze (10-100 recommended)
-
BarsToAnalyze: Historical bars to process for volume calculation
-
Color Scheme: Fully customizable colors for different volume intensities
-
Transparency: Adjust transparency of heatmap overlay
-
Panel Display: Toggle information panel on/off
3. Information Panel
-
Real-time statistics display including:
-
Number of bars analyzed
-
Total price levels
-
Price range
-
Total volume
-
Maximum volume per node
-
High volume nodes count (>70% of max volume)
-
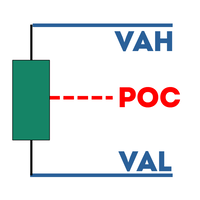
POC (Point of Control) - price level with highest volume
-
Color legend for volume intensity
-
4. Technical Implementation
-
Memory Efficient: Uses object-based drawing rather than indicator buffers
-
Automatic Updates: Timer-based refresh (every second)
-
Chart Integration: Properly cleans up objects on deinitialization
-
Price Range Detection: Dynamically calculates min/max prices from analyzed bars
How It Works
Volume Calculation Process:
-
Price Range Detection: Identifies highest and lowest prices from analyzed bars
-
Grid Creation: Divides price range into equal segments (GridLevels)
-
Volume Distribution: Distributes each bar's volume across price levels it touched
-
Intensity Normalization: Calculates relative volume intensity (0-100%)
-
Visual Rendering: Draws colored rectangles based on volume intensity
Key Algorithms:
-
Volume Accumulation: Aggregates volume at each price level
-
POC Detection: Identifies price with maximum volume concentration
-
Dynamic Scaling: Automatically adjusts to current price range
Trading Applications
1. Support/Resistance Identification
-
High volume nodes indicate significant support/resistance levels
-
Price levels with maximum volume (red zones) often act as key turning points
2. Volume Profile Analysis
-
Understand where volume is concentrated in the current price range
-
Identify volume voids (low volume areas) for potential breakout targets
3. Market Structure Analysis
-
Visualize volume distribution across the price range
-
Identify accumulation/distribution zones
4. Trade Entry/Exit Points
-
High volume areas can provide better liquidity for entries/exits
-
Low volume areas may indicate stop-loss hunting zones
Advantages
Compared to Traditional Volume Indicators:
-
Spatial Context: Shows volume relative to price levels, not just time
-
Visual Clarity: Color gradients make volume distribution immediately apparent
-
Historical Context: Shows volume profile over specified bar history
-
Multi-timeframe Analysis: Works on any timeframe while showing historical accumulation
安全须知
本产品仅通过 MQL5.com 官方渠道获取。其他渠道版本可能缺少完整功能和技术支持。
EA 配置
| 交易品种 | XAUUSD |
| 时间框架 | H1 (推荐) |
| 推荐经纪商 | IC Markets, IC Trading |
| 最低存款 | $300 / 0.01手 |
📸 截图预览