📝 产品详情
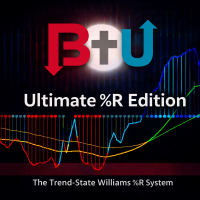
B2U Ultimate Percent R Edition
| 作者 | Yoon Jeonghui |
| 版本 | v1.0 |
| 更新 | 2026-01-29T06:56:47 |
| 激活数 | 0 |
B2U Market State System
Part of the B2U Market State System
A professional indicator suite designed to analyze market structure, trend state, and momentum.
B2U Market State System의 구성 요소입니다. 시장 구조, 추세 상태, 모멘텀을 입체적으로 분석하기 위한 전문 인디케이터 시스템입니다.
Visualizes momentum state and pressure balance within market structures.
B2U Ultimate %R Edition goes beyond the traditional Williams %R numeric oscillator.
과매수·과매도를 색상과 라인으로 ‘상태화’하다.”
B2U Ultimate %R Edition은 단순히 전통 Williams %R을 “과매수/과매도 숫자 지표”로 쓰는 방식에서 벗어나,
색상과 라인 구조로 추세 상태(State) 를 읽기 위해 설계된 트렌드-스테이트 오실레이터입니다.
B2U Ultimate Percent R Edition은 모멘텀 상태와 압력 균형을 분석하며, IFVG Zone 내부에서의 가격 반응이 유효한지 판단하는 데 도움을 줍니다.
B2U Ultimate Percent R Edition analyzes momentum state and pressure balance.
When combined with B2U IFVG BOX & Zone, it allows traders to assess whether momentum supports or rejects price reactions occurring within inverted FVG structures.
Instead of fixed overbought/oversold levels, it visualizes market state using
colors, line structure, histograms, and state dots.
This indicator does not generate buy/sell arrows.
It is not an entry signal tool, but a decision axis for trading judgment.
Key Components
1. %R Line (Main Momentum Line)
Range: 0 to -100 (traditional scale preserved)
Color changes based on:
Position vs Slow Signal (trend direction)
Position vs -50 center line (momentum balance)
Colors represent structural state, not simple up/down movement
2. Signal Line System (Fast / Slow)
Slow Signal: Primary trend baseline
Fast Signal: Short-term momentum response
Focus is not on a single crossover
Trend quality is defined by how long alignment is maintained
When %R → Fast → Slow align, the market is structurally trending
3. Momentum Histogram (Strength)
Measures distance from the -50 center line
Expansion → Trend strength
Contraction → Weakening or transition
Alignment + histogram weakening = trend exhaustion risk
4. Zero (-50) Line Trend Dots
Visual summary of market state at a glance
Color meanings
Light Blue: Strong bullish
Blue: Weak bullish
Red: Strong bearish
Maroon: Weak bearish
Gray: Sideways / non-trend
5. Dead Zone (Gray Filter)
±N range around -50
Automatically classified as non-trending
Filters false momentum and reduces overtrading
6. Overbought / Oversold Boxes
OB: 0 to -10 | OS: -90 to -100
OB/OS are state zones, not reversal signals
In strong trends, staying in OB/OS is normal
What matters is how structure exits, not entry
Practical Trading Guide
1.Trend Entry
Dots: Gray → Color
%R / Fast / Slow aligned structurally
Histogram expands in the same direction
2.Holding
Dots maintain strong colors
%R stays above/below Fast consistently
Histogram remains stable
3.Exit / Warning
Dots: Strong → Weak / Gray
Histogram contracts rapidly
%R breaks against Fast
Recommended Settings
Default Trend
WPR Length: 240
Fast: 65 | Slow: 130
Dead Zone: 26
Markets & Timeframes
XAUUSD, US100, NAS100,EURUSD, GBPUSD, BTCUSD, ETHUSD
M1 / M3 / M5/ M15–H1 in strong directional markets
Important Notice
- No automated buy/sell arrows
- This is a market state analysis tool, not a signal generator
- OB/OS zones are context zones, not reversal commands
The B2U Market State System is not a signal-based strategy,
but a modular framework for understanding where the market reacts, how it trends, and whether momentum supports that reaction.
安全须知
本产品仅通过 MQL5.com 官方渠道获取。其他渠道版本可能缺少完整功能和技术支持。
EA 配置
| 交易品种 | XAUUSD |
| 时间框架 | H1 (推荐) |
| 推荐经纪商 | IC Markets, IC Trading |
| 最低存款 | $300 / 0.01手 |
📸 截图预览