📝 产品详情
TMA Centered Bands Indicator
| 作者 | Irina Cherkashina |
| 版本 | v1.0 |
| 更新 | 2025-02-21T20:47:51 |
| 激活数 | 0 |
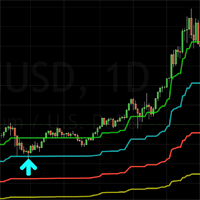
The TMA Centered Bands Indicator for MT5 draws bands on the chart and shows the overall price trend. It displays three bands - the lower and upper boundaries of the channel and the median.
The bands are made up of moving averages, and each of them has an MA period. The name TMA comes from triangular moving averages, as the indicator draws triangular bands.
The price will fluctuate between these ranges whenever the trend changes direction, thus creating entry and exit points.
How to trade with the TMA Centered Bands indicator?
The TMA Centered Bands indicator uses the power of the moving average to draw bands on the chart.
Each band has its own function. For example, when the price rises above the upper band, there is a chance that it will go down. Similarly, when the price falls below the lower band, there is a chance that it will go up.
When the price rises above the upper band, you can open short positions. On the other hand, you can open long positions when the price falls below the lower band. The middle boundary acts as an intermediary between the upper and lower boundaries.
Because the indicator signal is so easy to understand, even inexperienced traders can use it. On the other hand, experienced traders will find this indicator very useful (especially as a confluence) in their daily trading.
If you want an EA based on this indicator, contact us or look Centered Bands EA here:
https://www.mql5.com/en/market/product/129068?source=Site+Market+MT5+New+Rating006
安全须知
本产品仅通过 MQL5.com 官方渠道获取。其他渠道版本可能缺少完整功能和技术支持。
EA 配置
| 交易品种 | XAUUSD |
| 时间框架 | H1 (推荐) |
| 推荐经纪商 | IC Markets, IC Trading |
| 最低存款 | $300 / 0.01手 |
📸 截图预览