📝 产品详情
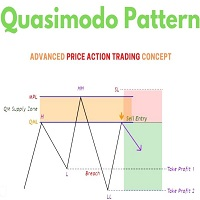
Quasimodo QM Pattern
| 作者 | Minh Truong Pham |
| 版本 | v197 |
| 激活数 | 11 |
| 原价 | $49 USD |
? Introduction
One of the patterns in "RTM" is the "QM" pattern, also known as "Quasimodo". Its name is derived from the appearance of "Hunchback of Notre-Dame" from Victor Hugo's novel. It is a type of "Head and Shoulders" pattern.
? Formation Method
? Upward Trend
In an upward trend, the left shoulder is formed, and the price creates a new peak higher than the left shoulder peak . After a decline, it manages to break the previous low and move upward again. We expect the price to return approximately between and to form the "QM" pattern. (Image 2)
? Downward Trend
In a downward trend, with a price decline, a new valley is created, forming the left shoulder, and the price forms a new valley lower than the left shoulder valley . After a price increase, it manages to break the previous high and move downward again. We expect the price to return approximately between and to form the "Quasimodo" pattern. (Image 3)
Note: The "QM" pattern is a specific type of head and shoulders pattern in which in the first move, the previous support is broken and it's the best condition for price reversal.
? Entry Conditions for "Buy" and "Sell"
? Buy
Buy Position: When a complete "QM" pattern is formed in a downtrend; we expect the price to reach the left shoulder area (with confirmation) during the retracement to enter the "BUY" position.
Profit Target in Buy Scenario: Expecting a move to the peak that broke it and the highest point in the current "Swing".
Stop Loss: Below the "Head," which is the lowest point. (Image 4)
? Sell
Sell Position: When a "QM" pattern is formed in an uptrend, we look for entry into the "Sell" position as the price retraces to the left shoulder area.
Profit Target in Sell Scenario: Expecting a move to the price floor that has been broken and the entire "Swing" or .
Take Profit: Above the highest point or above the area will be the "SL" region. (Image 5)
? Settings:
+ Lookback: Bar in history should calculate on time init inidicator
+ Pivot period: length of pivot point
+ Filter only QM at swing pivot zone (0 is not use): if input number bigger than " Pivot period setting", indicator just care about bullish QM near with this swing low and vice versal
===>
If this setting = 0, the indicator will recognize any QM (or head and shoulders) pattern that appears.
If this indicator is greater than 5 (for example = 60) the indicator will only identify patterns in the head and shoulders range that has the highest or lowest peak in the previous 60 candles.
So, if Filter only QM at swing pivot zone=0, the indicator will recognize more patterns, but sometimes the pattern detected does not represent a reversal.
If Filter only QM at swing pivot zone>5, the indicator will recognize fewer patterns. But the signal will be better
<===
+ Color settings
+ Notifications settings
Note: Certainly, no method alone guarantees trading capability and requires different confirmations. This indicator only detects the "QM" pattern, and the rest of the analysis will be the responsibility of the user.
Note: These profit and loss limits are based on market movements and will be provided as approximate and supportive.
Frequently Asked Questions
Why nothing show on chart when i load inidicator?
https://www.youtube.com/watch?v=hW-KHHvUCWI
How i build signal scan system with this indicator?
安全须知
本产品仅通过 MQL5.com 官方渠道获取。其他渠道版本可能缺少完整功能和技术支持。
EA 配置
| 交易品种 | XAUUSD |
| 时间框架 | H1 (推荐) |
| 推荐经纪商 | IC Markets, IC Trading |
| 最低存款 | $300 / 0.01手 |
📸 截图预览