📝 产品详情
GDXM Multi Symbol Comparisson Window
| 作者 | Gustavo Barros Alexandre D Almeida |
| 版本 | v1.28 |
| 激活数 | 0 |
GDXM Multi Symbol Comparisson Window
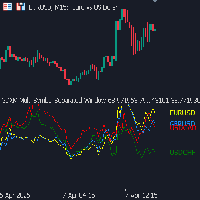
The Multi Symbol Correlation Oscillator GDXM is a precision tool engineered for institutional traders and Smart Money Concepts (SMC) practitioners. This version operates in a separate window, transforming the price action of up to 5 assets into a normalized 0–100% efficiency scale. It is the perfect solution for identifying high-probability divergences without cluttering your main price chart. There is a version for the main chart.
By isolating asset movements in a sub-window, traders can visually and mathematically pinpoint "cracks in correlation" (SMT). This reveals instances where one asset creates a new high/low while another fails to do so, uncovering the true intent of institutional "Smart Money".
Why use the Oscillator version?
-
Pure SMT Focus: Effortlessly spot divergences between correlated pairs (e.g., EURUSD vs. GBPUSD) or inverse correlations (e.g., EURUSD vs. DXY) within a perfect comparative scale.
-
Efficiency Scale (0-100%): All assets are adjusted to the same visual range, allowing you to fairly compare currencies with vastly different price points and volatilities.
-
Relative Strength Analysis: Instantly see which asset is leading the trend and which is showing signs of weakness, helping you select the pair with the highest explosive potential.
-
Clutter-Free Interface: Keep your main chart clean for PO3 markings, Fair Value Gaps, and Order Blocks, while shifting correlation monitoring to the bottom of your screen.
Exclusive Features
-
Monitor up to 5 Assets: Track multiple pairs, indices, or commodities simultaneously in a single sub-window.
-
Symbol Inversion: Invert the scale of inversely correlated assets so they all point in the same visual direction, making divergence reading much more intuitive.
-
Step Mode (Staircase): Perfect for visualizing Higher Timeframe (HTF) closes (like the Daily) in a linear format, ideal for tracking daily institutional bias.
-
Multi-Timeframe Sync: Plot data from higher timeframes directly into your execution window, keeping macro context always within reach.
Technical Parameters
-
Symbols (1 to 5): Choose the assets for comparison (e.g., DXY, USDJPY, AUDUSD).
-
Indicator Timeframe: Sets the base period for normalization (e.g., Daily to track the day's bias).
-
Lookback: The number of historical bars used to calculate the 0–100% scale's highs and lows.
-
Style Settings: Fully customize colors, line widths, and labels using the Verdana 8 font, ensuring a professional aesthetic for your workspace.
安全须知
本产品仅通过 MQL5.com 官方渠道获取。其他渠道版本可能缺少完整功能和技术支持。
EA 配置
| 交易品种 | XAUUSD |
| 时间框架 | H1 (推荐) |
| 推荐经纪商 | IC Markets, IC Trading |
| 最低存款 | $300 / 0.01手 |
📸 截图预览