📝 产品详情
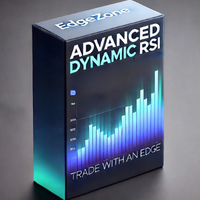
EZ Advanced Dynamic RSI
| 作者 | Danijel Plesa |
| 版本 | v1.4 |
| 更新 | 2024-10-11T22:48:54 |
| 激活数 | 0 |
Advanced Dynamic RSI
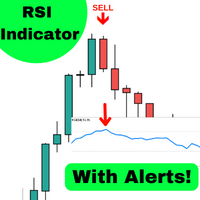
The **Advanced Dynamic RSI** indicator builds on the classic Relative Strength Index (RSI) developed by J. Welles Wilder. It incorporates volatility-adaptive overbought and oversold levels using moving averages and standard deviation calculations. This adaptation helps the levels adjust to current market conditions, offering a more responsive oscillator compared to fixed thresholds.
The indicator is suitable for various instruments and timeframes, supporting analysis in different market environments.
Symbol: All instruments (e.g., EURUSD, SP500, GOLD)
Platform: MetaTrader 5
Type: Indicator
Key Features
The indicator includes the following main features:
- Standard Wilder RSI calculation as the core foundation.
- Dynamic overbought and oversold levels that adapt based on volatility (using moving averages and standard deviation).
- Optional smoothing applied to the RSI line for reduced noise.
- Customization options for colors and line styles of the levels and RSI line.
Input Parameters
The indicator provides the following adjustable inputs:
- RSI Period (integer value).
- Price Source: Options include Close, Open, High, Low, Median, Typical, or Weighted.
- Overbought/Oversold Levels: Choice between static values (e.g., 70/30) or dynamic calculation.
- Smoothing Factor: Range from 0.0 to 1.0 to control the degree of smoothing.
- Dynamic Levels Settings: Period for calculation and volatility multiplier.
Usage Guidelines
To use the indicator:
- Attach it to any chart and timeframe.
- In periods of higher volatility, consider enabling dynamic levels for adaptive bands.
- In ranging markets, static levels may provide clearer reference points.
- Combine with other forms of analysis, such as trend indicators or volume, for additional context.
Example applications include scalping on M15 charts for pairs like EURUSD or swing analysis on H1 for commodities like GOLD. Oscillators like RSI generally perform better in sideways markets; in strong trends, signals may require caution.
Support
For installation: Download and attach the indicator to your chart.
For questions or further details, use the comments section on this product page or contact via MQL5 messaging system.
Risk Disclaimer
This is an analytical tool and does not provide trading signals. Trading involves risk, and past performance is no indication of future results. Use proper risk management and verify with multiple analysis methods.
安全须知
本产品仅通过 MQL5.com 官方渠道获取。其他渠道版本可能缺少完整功能和技术支持。
EA 配置
| 交易品种 | XAUUSD |
| 时间框架 | H1 (推荐) |
| 推荐经纪商 | IC Markets, IC Trading |
| 最低存款 | $300 / 0.01手 |
📸 截图预览