📝 产品详情
Institutional Swing Map
| 作者 | Danny Giovanni Romero Lozano |
| 版本 | v1.0 |
| 激活数 | 0 |
Institutional Swing Map
Institutional Swing Map is a powerful visual indicator designed to help traders clearly understand daily market structure by connecting highs and lows and highlighting key price zones.
It operates on a higher timeframe (default: Daily) and projects that structure directly onto your current chart, giving you a clearer perspective of market behavior.
Key Features
High-to-High & Low-to-Low Connections
Automatically draws trend lines connecting consecutive daily highs and lows, helping identify structure, trend continuity, and shifts.
Smart Vertical Separators
Displays dynamic vertical separators between periods, highlighting transitions between daily sessions using adaptive price ranges instead of infinite lines.
Mid-Level Structure (Equilibrium)
Plots midpoint levels between highs and lows, providing insight into equilibrium zones and potential reaction areas.
Previous Day Range (ADR-style Levels)
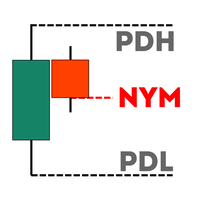
Projects previous day’s high, low, and midpoint forward into the next session—useful for:
Support & resistance
Liquidity zones
Intraday targets
Optional Candle Visualization
Reconstructs higher timeframe candles directly on your chart with customizable colors and optional filled bodies.
Real-Time Updating
Continuously adapts to the latest market data, including the current forming candle.
Customization Options
Enable/disable:
Trend lines
Structure boxes (vertical separators)
Candle visualization
Adjustable:
Colors (highs, lows, midpoint, candles)
Line styles and thickness
Number of historical bars to analyze
Use Cases
This indicator is ideal for:
Smart Money Concepts (SMC)
Market structure analysis
Intraday trading with higher timeframe bias
Identifying liquidity zones and key reaction levels
Visual backtesting of price behavior
How It Helps
Swing Connector simplifies complex price action into a clean, structured view.
Instead of manually marking highs, lows, and ranges, the indicator does it automatically—allowing you to focus on decision-making and execution.
安全须知
本产品仅通过 MQL5.com 官方渠道获取。其他渠道版本可能缺少完整功能和技术支持。
EA 配置
| 交易品种 | XAUUSD |
| 时间框架 | H1 (推荐) |
| 推荐经纪商 | IC Markets, IC Trading |
| 最低存款 | $300 / 0.01手 |
📸 截图预览