📝 产品详情
Heat MA
| 作者 | Jean Carlos Souza |
| 版本 | v3.0 |
| 激活数 | 0 |
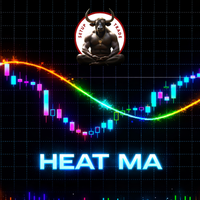
The Heat MA indicator is a powerful visual tool designed to identify the intensity of trading flow and market pressure directly on your chart. It appears as a continuous line that changes color, offering clear signals about price behavior and underlying volume.
1. How Heat MA Appears on the Chart
Imagine a single, robust line (4 pixels thick) that moves along with the price. This line is not just a trace; it's a market thermometer, and its color is the key to understanding what's happening.
2. The Meaning of Colors (The Market Thermometer)
The color of the Heat MA line is the heart of the indicator. Each color represents a different level of volume activity, like a heatmap:
| Line Color | Meaning | Market Implication |
|---|---|---|
| Cyan (Cold) | Low volume activity. | The market is "frozen," with little movement, exhaustion of a previous move, or sideways movement without strength. |
| Lime (Neutral) | Average trading volume. | Normal market activity. Price may be consolidating or moving without significant pressure. |
| Orange (Warm) | Increased trading flow. | A "warming up" of the market, indicating the beginning of institutional pressure or an imminent price breakout. |
| Crimson (Hot Coals) | Extreme trading flow. | The market is "boiling," with high volatility. This could be the climax of a move (start of a strong trend or the end of an exhaustion). |
3. Additional Information on the Chart
You will see the name Heat-MA (Period) in the upper left corner of your chart. This simply identifies the indicator and the period it is analyzing. The Heat MA does not add numbers or scores over the candles; all important information is conveyed by the line's color and its position relative to the price.
4. How to Use Heat MA for Trading (Trading Signals)
The Heat MA provides clear signals to help you make buy, sell, or exit decisions. The logic is simple:
BUY Signal (Long)
To consider a buy, observe two criteria:
- Price Above Heat MA Line: The price should be trading above the colored line.
- Color Transition: The line's color should change from Lime (Neutral) or Cyan (Cold) to Orange (Warm) or Crimson (Hot Coals). This indicates that volume is increasing and pushing the price up.
SELL Signal (Short)
To consider a sell, observe two criteria:
- Price Below Heat MA Line: The price should be trading below the colored line.
- Color Transition: The line's color should change from Lime (Neutral) or Cyan (Cold) to Orange (Warm) or Crimson (Hot Coals). This indicates that volume is increasing and pushing the price down.
TARGET/EXIT Signal
When is it time to exit a trade or take profits?
- Line Color Change: The line's color changes from Crimson (Hot Coals) or Orange (Warm) back to Lime (Neutral) or Cyan (Cold). This suggests that volume pressure is decreasing, and the movement may be losing strength.
NEUTRALITY Signal (Stay Out)
In some situations, it's best not to trade:
- Cyan Line: If the line is Cyan (Cold), the market lacks volume and clear direction.
- Price Repeatedly Crossing the Line: If the price is crossing the Heat MA line multiple times in a short period, this indicates a "cold" or sideways market, without a defined trend. It's a good time to wait for clearer signals.
Conclusion
The Heat MA is an intuitive tool that combines price action with volume intensity, simplifying market reading. By understanding the meaning of colors and their relationship to price, you can identify opportunities and manage your trades more effectively.
安全须知
本产品仅通过 MQL5.com 官方渠道获取。其他渠道版本可能缺少完整功能和技术支持。
EA 配置
| 交易品种 | XAUUSD |
| 时间框架 | H1 (推荐) |
| 推荐经纪商 | IC Markets, IC Trading |
| 最低存款 | $300 / 0.01手 |
📸 截图预览