📝 产品详情
Auto Trend Fit
| 作者 | Ross Adam Langlands Nelson |
| 版本 | v1.0 |
| 更新 | 2021-05-10T22:45:19 |
| 激活数 | 0 |
Automatic Trend Line Fit.
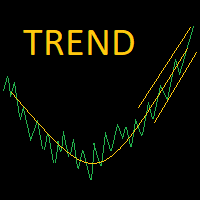
This indicator automatically plots the straight line and parabolic (curved) trend to any symbol at any timeframe. The plotted straight line is a good indication of the current trend and the curved line is an indication of a change momentum or change in the current trend.
Plotting the straight line over about 2/3 the number of candles as the curved line is usually a good way to determine entry and exit points as it shows the current trend and momentum of the market.
This indicator also gives the option of plotting a channel around both the straight line and curved line for more well timed entry and exit points. This channel is set at a multiple of the ATR above and below the trend lines.
The inputs required are the number of candles to fit the curved line to (numCurve), the number of candles to fit the straight line to (numStraight) and the ATR multiple to set the channel lines (ATRBounds).
安全须知
本产品仅通过 MQL5.com 官方渠道获取。其他渠道版本可能缺少完整功能和技术支持。
EA 配置
| 交易品种 | XAUUSD |
| 时间框架 | H1 (推荐) |
| 推荐经纪商 | IC Markets, IC Trading |
| 最低存款 | $300 / 0.01手 |
📸 截图预览