📝 产品详情
Entry Signal Probability
| 作者 | Tevon R Gardiner |
| 版本 | v1.0 |
| 更新 | 2025-02-26T23:09:15 |
| 激活数 | 0 |
This indicator helps identify the start of significant market movements by analyzing candle patterns and their relative price action strength
Key Features:
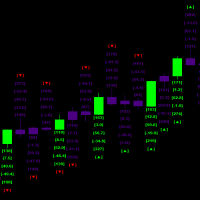
- Color-coded candles showing strong and weak movements
- Labels displaying key metrics for each candle
- Built-in wave and movement tolerance settings\
- Pay close attention to the values of the red and green colored text labels as they are the most important Factor of whether or not a signal will be successful
How to Use:
-
Look for Strong Signals:
- Lime candles: Strong bullish movements
- Red candles: Strong bearish movements
- Indigo candles: Weaker movements in both directions
-
Wave Analysis:
- Watch for clusters of strong-colored candles
- These often indicate the start of significant market waves
- Use the displayed metrics to confirm the strength of movements
-
Entry/Exit Points:
- Strong color transitions often signal potential trading opportunities
- Multiple consecutive strong candles can indicate trend continuation
- Weak color patterns might suggest consolidation or trend exhaustion
For:
- Swing trading
- Trend following
- Wave pattern trading
- Momentum trading strategies
The indicator works best when used in conjunction with your existing trading strategy as a confirmation tool for market movements and potential entry/exit points.
安全须知
本产品仅通过 MQL5.com 官方渠道获取。其他渠道版本可能缺少完整功能和技术支持。
EA 配置
| 交易品种 | XAUUSD |
| 时间框架 | H1 (推荐) |
| 推荐经纪商 | IC Markets, IC Trading |
| 最低存款 | $300 / 0.01手 |
📸 截图预览