📝 产品详情
Dashboard RSI Multi Time Frame for MT5
| 作者 | Keith Watford |
| 版本 | v1.0 |
| 更新 | 2020-03-16T03:59:08 |
| 激活数 | 0 |
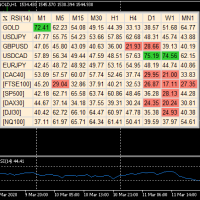
A useful dashboard that shows the RSI values for multiple symbols and Time-frames.
It can be easily hidden/displayed with a simple click on the X top left of the dashboard.
You can input upper and lower RSI values and the colours can be set to show when above/below these values. The default values are 70 and 30.
You can choose whether the dashboard is displayed on the right or left of the chart.
If you want to have 2 dashboards on the same chart you must input a different name for each.
The scan is set on a timer and the default input is every 3 seconds. You can set it to a different period in the inputs
Symbols and time-frames are input separated by commas.
This indicator only uses standard time-frames. ie. M1,M5,M15,M30,H1,H4,D1,W1,MN1.
Symbols can also be loaded from the Market Watch window. If there are more than 30 symbols, only the first 30 will be loaded.
Important
I advise that you only use this dashboard with symbols and time-frames that you generally work with.
The iCustom handles are set up at initialization and that can be a problem if the history for the symbol and time-frame is not up to date.
In such case, the indicator will not be initialized and you will need to restart it. There will be a report in the Experts tab for the symbol and
time-frame where getting the handle failed.
If getting the handle keeps failing for the same symbol, you should open the chart and check that there is enough history. If not, delete it
from the list.
安全须知
本产品仅通过 MQL5.com 官方渠道获取。其他渠道版本可能缺少完整功能和技术支持。
EA 配置
| 交易品种 | XAUUSD |
| 时间框架 | H1 (推荐) |
| 推荐经纪商 | IC Markets, IC Trading |
| 最低存款 | $300 / 0.01手 |
📸 截图预览