📝 产品详情
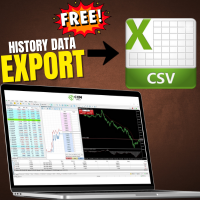
Export History Data to CSV
| 作者 | Muhammad Jawad Shabir |
| 版本 | v3.0 |
| 更新 | 2025-11-26T09:18:07 |
| 激活数 | 5 |
Crystal AI Data Extractor — Get Clean MT5 Data Into Excel or Python in One Click
If you have ever tried to pull historical data out of MetaTrader 5 and ended up with a messy file where everything lands in one column — this tool is for you. Crystal AI Data Extractor does one job and does it properly: it takes your MT5 chart data and saves it as a clean, properly separated CSV file that opens correctly in Excel, Python, or any other tool you use.
No more copying and pasting from the terminal. No more broken exports. No more wasting time fixing data before you can even start your analysis.
Two Modes — Pick What You Need
Tick Mode — If you want to record every single price movement as it happens live, this is your mode. Every bid, ask and price update gets written to the file in real time. Useful if you are studying spread behavior, session volatility, or building a tick-by-tick dataset.
OHLC Mode — If you want classic candle data (open, high, low, close, volume, spread) on any timeframe from M1 to Monthly, use this mode. You can pull 500 bars of history the moment the EA starts, and it keeps adding new closed bars as the market moves.
What Gets Saved to the File
When running in Tick Mode, each row contains:
| Column | What It Means | Example |
|---|---|---|
| Time | Exact time of the price update | 2025.01.15 09:00:01 |
| Bid | Bid price at that moment | 2624.54 |
| Ask | Ask price at that moment | 2624.65 |
| Last | Last traded price (shows 0 on most forex brokers — this is normal) | 0.00 |
| TickCount | How many ticks arrived within the same second | 4 |
When running in OHLC Mode, each row contains:
Settings You Need to Know
| Setting | Default | What to Set |
|---|---|---|
| Data Mode | TICK | Choose TICK for live price data, or OHLC for candle bar data. |
| Timeframe | M1 | Only matters in OHLC mode. Set it to whichever candle size you want — M1, H1, D1, anything. |
| Lookback Bars | 500 | How many past candles to dump into the file when the EA first starts. Set to 0 if you only want new candles going forward. |
| File Prefix | (blank) | Optional. Add a label to the filename so you can tell exports apart. For example "London" gives you London_XAUUSD_Ticks.csv. |
Supported Timeframes
| Group | Timeframes |
|---|---|
| Minutes | M1, M2, M3, M4, M5, M6, M10, M12, M15, M20, M30 |
| Hours | H1, H2, H3, H4, H6, H8, H12 |
| Higher | D1, W1, MN1 |
How Your File Gets Named
- OHLC on Gold, H1 timeframe: XAUUSD_H1_OHLC.csv
- OHLC on Gold, H1, prefix "Jan": Jan_XAUUSD_H1_OHLC.csv
- Tick data on Gold: XAUUSD_Ticks.csv
- Tick data on Gold, prefix "London": London_XAUUSD_Ticks.csv
Where to Find Your File After Export
This is the part that catches most people out. MT5 saves files in a different folder depending on whether you ran the EA on a live chart or inside the Strategy Tester.
If you ran it on a live chart:
- In MT5, click File → Open Data Folder
- Go into the MQL5 folder, then Files
- Your CSV file is in there
If you ran it in the Strategy Tester:
- In MT5, click File → Open Data Folder
- Go into the Tester folder
- Open the [AgentID] folder, then Agent-127.0.0.1-3000
- Go into MQL5 → Files
- Your CSV file is in there
The EA also prints the exact file path in the Journal tab every time it starts and every time it stops — so if you ever can't find the file, just check the journal and it will tell you exactly where to look.
Live Chart vs Strategy Tester — What's the Difference?
| Live Chart | Strategy Tester | |
|---|---|---|
| Where does the data come from? | Your broker's live feed | MT5's stored history |
| Can I use Tick Mode? | Yes | Yes |
| Can I use OHLC Mode? | Yes | Yes |
| Do I need the market to be open? | Yes | No — any date range, anytime |
| Best for | Recording live sessions | Pulling months or years of history in one go |
| Where is the file saved? | MQL5\Files\ | Tester\...\MQL5\Files\ |
How to Use It — Step by Step
To pull historical OHLC data (Strategy Tester):
- Attach the EA in the Strategy Tester. Pick your symbol and date range.
- Set Data Mode = OHLC and choose your timeframe (e.g. H1).
- Set Lookback Bars = 0 — the tester date range covers everything.
- Set the tester chart timeframe to something lower than your OHLC timeframe. For example, if you want H1 data, run the tester on M5.
- Hit Start. When finished, find the file inside: Tester → [AgentID] → Agent-127.0.0.1-3000 → MQL5 → Files
To record live tick data:
- Drop the EA onto any live chart of the symbol you want.
- Set Data Mode = TICK. Add a File Prefix if you want to label this session.
- Leave it running. The file grows in real time as ticks come in.
- When you are done, remove the EA from the chart. The file closes safely and the path is printed to the Journal.
- Find the file inside: MQL5 → Files
This Tool Is For You If...
- You want to backtest a strategy in Python or Excel using real MT5 price data
- You are building an AI or machine learning model and need clean historical candles
- You want to study spread patterns, tick flow, or session volatility
- You are tired of MT5's built-in export producing files that need fixing before use
- You need years of OHLC data from your broker without any manual downloading
- You want a simple tool that just works without any complicated setup
Important: This EA does not trade. It does not open, modify or close any positions. It has no effect on your account. Data quality depends on the history your broker has available in MT5. Always check your data before using it in live trading decisions.
© Crystal AI Systems · jawadtrader22
安全须知
本产品仅通过 MQL5.com 官方渠道获取。其他渠道版本可能缺少完整功能和技术支持。
EA 配置
| 交易品种 | XAUUSD |
| 时间框架 | H1 (推荐) |
| 推荐经纪商 | IC Markets, IC Trading |
| 最低存款 | $300 / 0.01手 |
📸 截图预览