📝 产品详情
Average Daily Range Annotator
| 作者 | Aurthur Musendame |
| 版本 | v1.0 |
| 激活数 | 0 |
The Average Daily Range (ADR) is a powerful tool for traders, especially those focused on intraday and scalping strategies. It provides valuable insights into the expected price movement for the day and how price action is behaving relative to historical trends. The ADR indicator shows the following key information:
- Today's ADR: The typical range of price movement for the current trading day, based on historical data.
- 3x Today's ADR: Three times the current ADR, showing potential price movement if the current trend continues to expand beyond the average range.
- Price Movement Today: How much the price has already moved within the day, giving you a sense of whether the price is nearing or has already hit its expected range.
- Yesterday's ADR: The average daily range from the previous day, helping you compare today's movement with that of the prior session.
- Points to ADR High/Low: The number of points the current price would need to move to reach the ADR high or low, offering insight into potential price targets.
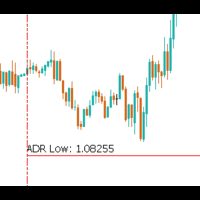
- Today's ADR High & Low Prices: The expected high and low points for the day based on today's ADR calculation.
- ADR Reached Today: A simple "Yes" or "No" indicator showing whether today's ADR high or low has been met or exceeded, which can signal potential price exhaustion or reversals.
- Weekly ADR: The average range of price movement for the entire week, providing a broader context for price action.
- Last Week's ADR: The ADR from the previous week, offering a comparative measure to assess how current price action stacks up against past behavior.
The indicator also color-codes the ADR levels. When the price reaches or exceeds the ADR high or low, the indicator will change the lines from blue to red to indicate that the ADR has been met. This suggests that price may be reaching its typical daily range, and significant further movement may be less likely. Alerts are also provided to notify traders when these ADR levels are hit, helping them stay proactive in managing their trades.
By integrating this information, traders can use the ADR indicator to:
- Time entries and exits: Look for potential reversals when ADR levels are reached.
- Ride intraday trends: Identify whether the price is likely to continue moving within its average range.
- Enhance strategy confluence: Combine ADR with other technical indicators or strategies for improved decision-making.
The ADR indicator is an excellent tool for staying informed about price action, helping you make more precise and confident trading decisions throughout the day.
安全须知
本产品仅通过 MQL5.com 官方渠道获取。其他渠道版本可能缺少完整功能和技术支持。
EA 配置
| 交易品种 | XAUUSD |
| 时间框架 | H1 (推荐) |
| 推荐经纪商 | IC Markets, IC Trading |
| 最低存款 | $300 / 0.01手 |
📸 截图预览