📝 产品详情
Trades Visualizer
| 作者 | Gordana Batic |
| 版本 | v1.2 |
| 更新 | 6 四月 2026 |
| 激活数 | 0 |
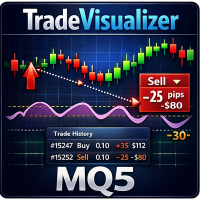
TradeVisualizer is a dynamic chart-based indicator for MetaTrader 5, designed to visually display recent trades directly on the chart. It includes:
Trade arrows for entry and exit points, color-coded by direction and profit/loss.
Dotted lines connecting open and closed trades.
Profit/loss labels in pips and currency.
Interactive toggle button to show/hide drawings.
Trade history panel showing time, ticket, type, lot size, pips, and P/L.
Customizable appearance via inputs for colors, fonts, and layout.
Handles both open positions and closed deals, with correct inversion logic for deal types.
This tool is ideal for traders who want a clear, visual summary of their trading activity without digging through the terminal history.
TradeVisualizer is a lightweight indicator.
It will not slow down MT5, even on older machines.
Why?
No heavy loops
No tick‑based processing
Only simple chart objects
Efficient cleanup
Minimal indicator handles (only ATR)
安全须知
本产品仅通过 MQL5.com 官方渠道获取。其他渠道版本可能缺少完整功能和技术支持。
EA 配置
| 交易品种 | XAUUSD |
| 时间框架 | H1 (推荐) |
| 推荐经纪商 | IC Markets, IC Trading |
| 最低存款 | $300 / 0.01手 |
📸 截图预览