📝 产品详情
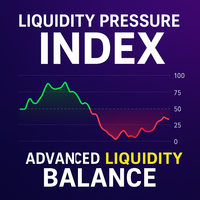
Liquidity Pressure Index
| 作者 | Murtadha Majid Jeyad Al-Khuzaie |
| 版本 | v1.0 |
| 激活数 | 0 |
Liquidity Pressure Index (LPI) is an advanced technical indicator designed to uncover the hidden battle between buyers and sellers in the market. Unlike conventional oscillators that only rely on price movements, LPI integrates market depth (order book data), ATR-based volatility compression, and adaptive smoothing to give traders a deeper view of true liquidity dynamics.
By combining price action with volume absorption and order flow pressure, the LPI helps traders anticipate shifts in market sentiment long before they are visible on the chart.
How to Read the Indicator
The Liquidity Pressure Index is plotted on a 0–100 scale, with a baseline at 50. The interpretation is straightforward:
Above 50 – Green Line: Represents buy-side liquidity pressure. Buyers dominate, and hidden bid-side orders are absorbing supply, often signaling bullish continuation or market recovery.
Below 50 – Red Line: Represents sell-side liquidity pressure. Sellers dominate, and hidden ask-side orders are absorbing demand, often signaling bearish continuation or breakdown.
Around 50 (Gray Neutral Zone): Buyers and sellers are balanced. This suggests indecision or temporary consolidation before the next strong move.
The indicator’s color-coded visualization makes it easy to read at a glance: green for bullish liquidity pressure, Red for bearish liquidity pressure.
How the Indicator Works
Volatility Compression Detection: By comparing candle ranges with ATR, the LPI detects when price action is being absorbed by hidden liquidity.
Market Book Integration: On the latest bar, it analyzes the top N levels of the order book (default 5) to calculate real-time buy/sell accumulation.
Directional Volume Weighting: Tick volume and candle direction are factored in to determine whether pressure comes from buyers or sellers.
Adaptive Smoothing: Traders can choose between EMA smoothing for responsiveness or KAMA smoothing for adaptive noise reduction.
Normalized Scaling: All values are normalized between 0 and 100 for universal interpretation.
This makes the LPI highly versatile and effective across multiple assets and timeframes.
Key Features & Benefits
Clear Color Coding: Green line for buy pressure, Red line for sell pressure.
Real-Time Liquidity Insight: Uses actual order book data for the most recent bar to detect hidden liquidity flow.
Compression Detection: Identifies zones where institutional players absorb volume before major moves.
Customizable Smoothing: Choose between fast-reacting EMA or adaptive KAMA for noise reduction.
Final Thoughts
The Liquidity Pressure Index is more than just another oscillator—it is a powerful liquidity mapping tool that reveals where the real battle between buyers and sellers is happening. By combining price, volatility, and order book dynamics, it equips traders with early signals of accumulation, distribution, and breakout potential.
Whether you trade intraday or swing positions, LPI gives you clarity on hidden liquidity flows that traditional indicators cannot show.
安全须知
本产品仅通过 MQL5.com 官方渠道获取。其他渠道版本可能缺少完整功能和技术支持。
EA 配置
| 交易品种 | XAUUSD |
| 时间框架 | H1 (推荐) |
| 推荐经纪商 | IC Markets, IC Trading |
| 最低存款 | $300 / 0.01手 |
📸 截图预览