📝 产品详情
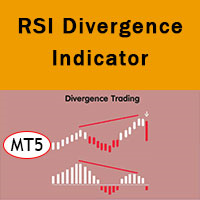
Investment Castle RSI Divergence MT5
| 作者 | Ahmed Alaaeldin Abdulrahman Ahmed Elherzawi |
| 版本 | v1.2 |
| 更新 | 2023-08-21T15:50:43 |
| 激活数 | 0 |
Features:
- Automatic Detection: The indicator scans the chart for RSI divergences and automatically plots arrows to signal potential trade opportunities.
- Buy and Sell Signals:
- Green Upward Arrow: Suggests a potential buy opportunity based on bullish RSI divergence.
- Red Downward Arrow: Suggests a potential sell opportunity based on bearish RSI divergence.
- Divergence Strength Identification: The indicator differentiates between weak and strong divergences, giving traders more nuanced insight.
- Strong Divergence: Denoted by a bold arrow.
- Weak Divergence: Denoted by a fainter arrow.
- Mobile Notifications: Built-in mobile notification feature ensures that you never miss a potential trading signal, even when you're on the move. Once a divergence is spotted, the indicator sends a push notification to your mobile device.
- Customizable Settings: Users can adjust the RSI period, overbought and oversold levels, and other settings to tailor the indicator to their trading style and preferences.
How It Works:
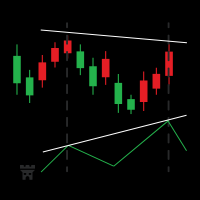
- Bullish Divergence (Buy Signal): Occurs when the price forms a new lower low, but the RSI forms a higher low. This discrepancy may indicate a potential upward reversal.
- Bearish Divergence (Sell Signal): Occurs when the price forms a new higher high, but the RSI forms a lower high. This discrepancy may suggest a potential downward reversal.
- Strength of Divergence: The distinction between weak and strong divergences is based on the difference in the price and RSI peaks/troughs. A greater discrepancy denotes a strong divergence, while a smaller one indicates a weak divergence.
Use Cases:
- Trend Identification: Traders can use RSI divergences to identify potential beginnings or ends of trends.
- Risk Management: By recognizing potential reversals, traders can adjust stop-loss and take-profit levels accordingly.
- Strategy Integration: The RSI Divergence Indicator can be integrated with other trading strategies to provide added layers of confirmation.
Note:
Trading on the basis of divergences alone can be risky. It's crucial to utilize other technical analysis tools and methods for confirmation. Always use appropriate risk management techniques to protect your capital.
安全须知
本产品仅通过 MQL5.com 官方渠道获取。其他渠道版本可能缺少完整功能和技术支持。
EA 配置
| 交易品种 | XAUUSD |
| 时间框架 | H1 (推荐) |
| 推荐经纪商 | IC Markets, IC Trading |
| 最低存款 | $300 / 0.01手 |
📸 截图预览