📝 产品详情
Heat map volumne bar color
| 作者 | Minh Vuong Pham |
| 版本 | v1.0 |
| 激活数 | 0 |
What Is This Indicator?
Group support: https://www.mql5.com/en/channels/vuongphamtrading
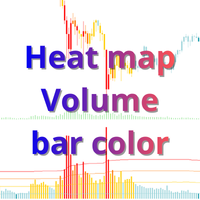
Heatmap Volume BarColor is a companion indicator that paints your candlesticks directly on the main chart based on volume intensity. It uses the exact same logic as the Heatmap Volume indicator (separate window) but applies the color-coding to the candles themselves.
Instead of looking down at the volume window, you can read volume strength at a glance right on the price chart.
How It Works
Each candle is colored according to how many standard deviations its volume is from the moving average:
| Candle Color | Volume Level | What It Means |
|---|---|---|
| ? Red | Extra High (> 4σ) | Extreme volume — institutional activity likely |
| ? Orange | High (> 2.5σ) | Significantly above normal — strong participation |
| ? Yellow | Medium (> 1σ) | Above average — market is engaged |
| ? Light blue | Normal (> -0.5σ) | Typical volume — nothing unusual |
| ? Teal | Low (≤ -0.5σ) | Below average — thin market, low conviction |
In Up/Down color mode, bullish and bearish candles get separate color palettes (green shades for up, red shades for down), so you can see both direction and volume intensity simultaneously.
Setup: Using Both Indicators Together
For the best experience, apply both indicators to your chart:
- HeatmapVolume → separate window (volume histogram + heatmap threshold lines)
- HeatmapVolume_BarColor → main chart (colored candles)
Make sure both indicators share the same parameter values (MA Length, StdDev Length, Thresholds). Otherwise the colors on the candles won't match the levels shown in the volume window.
What each one gives you:
| BarColor (main chart) | Heatmap Volume (separate window) | |
|---|---|---|
| Strength | Instant visual on every candle | Precise measurement via histogram |
| Best for | Quick scanning, pattern recognition | Detailed analysis, threshold comparison |
| Shows | Volume intensity on price action | Exact volume bars + threshold lines |
Trading with BarColor on the Main Chart
1. Scan for High-Volume Candles at Key Levels
The primary advantage of BarColor is speed. As you scroll through charts or watch multiple pairs, colored candles immediately draw your eye to where volume matters.
What to look for:
- ? Red or ? orange candles at support/resistance zones → something significant is happening at that level.
- A cluster of ? teal candles followed by a sudden ? red candle → breakout from low-volatility compression.
- ? Light blue candles during a breakout → weak conviction, likely a false move.
2. Read Candlestick Patterns with Volume Context
BarColor transforms standard candlestick analysis by adding a volume dimension:
Engulfing patterns:
- Bullish engulfing + ? red/? orange → high-confidence reversal signal.
- Bullish engulfing + ? teal → low volume, treat as unreliable.
Pin bars / Hammers:
- Pin bar at support + ? orange or higher → strong rejection, good entry.
- Pin bar + ? teal → weak rejection, wait for confirmation.
Doji:
- Doji + ? red → heavy two-way battle, expect a big move next. Wait for direction confirmation before entering.
- Doji + ? teal → market is asleep, skip.
3. Trail Trends by Color
During a trend, watch the candle colors evolve:
- Consistent ? yellow or ? orange candles with trend → healthy momentum, hold your position.
- Colors fading from ? yellow to ? blue to ? teal → momentum is dying, tighten your stop or take partial profit.
- Sudden ? red candle against the trend → potential reversal or at least a deep pullback. Don't ignore it.
4. Spot Divergences Between Price and Volume
Sometimes price makes a new high, but the candle color tells a different story:
- Price makes higher high but candle is ? teal/? blue (previous high was ? yellow/? orange) → bearish divergence. The new high lacks volume support — trend is weakening.
- Price makes lower low but candle is only ? teal (previous low was ? red) → selling pressure is drying up. Watch for reversal.
Combining BarColor with the Heatmap Volume Window
This is where the two indicators complement each other:
Quick Scan → Deep Dive Workflow
Step 1: Scan the main chart (BarColor) └─ Spot ? red or ? orange candles at interesting price levels Step 2: Check the volume window (Heatmap Volume) └─ See exactly where the volume bar sits relative to the threshold lines └─ Confirm whether it barely crossed a threshold or massively exceeded it Step 3: Make your decision └─ BarColor says "pay attention here" └─ Heatmap Volume tells you "how extreme it really is"
Specific Combination Scenarios
Breakout confirmation:
- BarColor: breakout candle is ? orange or ? red → initial green light.
- Heatmap Volume: volume bar clearly above the High (orange) threshold line → confirmed. Enter.
- Heatmap Volume: volume bar barely touches the Medium (yellow) line → borderline. Wait for follow-through on the next candle.
Exhaustion detection:
- BarColor: ? red candle at end of extended trend → possible climax.
- Heatmap Volume: volume bar towers above Extra High line → strong exhaustion signal. Prepare to exit or reverse.
Low-volume warning:
- BarColor: candles have been ? teal for many bars → compression phase.
- Heatmap Volume: volume bars are flat below the Normal line → confirms low activity. Set alerts for when volume spikes and wait.
Conflicting signals:
- BarColor: candle looks ? yellow (Medium) → seems decent.
- Heatmap Volume: the volume bar is right at the Medium threshold line, barely above → marginal. Don't treat this as a strong signal. Require additional confirmation from price action or other indicators.
Parameter Matching Checklist
Since both indicators run independently, ensure these match:
| Parameter | BarColor | Heatmap Volume | Must match? |
|---|---|---|---|
| MA Length | 610 | 610 | ✅ Yes |
| StdDev Length | 610 | 610 | ✅ Yes |
| Volume Type | Tick | Tick | ✅ Yes |
| Extra High Multiplier | 4.0 | 4.0 | ✅ Yes |
| High Multiplier | 2.5 | 2.5 | ✅ Yes |
| Medium Multiplier | 1.0 | 1.0 | ✅ Yes |
| Normal Multiplier | -0.5 | -0.5 | ✅ Yes |
| Color Mode | Your choice | Your choice | Optional |
If parameters don't match, a candle might show ? orange on the chart but the volume bar in the window would be at a different threshold level — which creates confusion.
Heatmap Mode vs Up/Down Mode
Both indicators offer two color modes. Choose based on your trading style:
Heatmap mode (default, Up/Down = false ):
- Both bullish and bearish candles share the same color palette (red/orange/yellow/blue/teal).
- Best when you only care about volume intensity, regardless of direction.
- Useful for: breakout confirmation, exhaustion detection, compression scanning.
Up/Down mode ( Up/Down = true ):
- Bullish candles use green shades, bearish candles use red shades. Brighter = more volume.
- Best when direction matters as much as intensity.
- Useful for: trend analysis, accumulation/distribution reading, candlestick pattern grading.
Common Mistakes
-
Mismatched parameters. If BarColor and Heatmap Volume have different settings, the colors won't correspond to the threshold lines. Always sync them.
-
Over-relying on candle color alone. BarColor is a quick-scan tool. For important trading decisions, always cross-reference with the Heatmap Volume window to see exact levels.
-
Ignoring the candle body. A ? red candle with a tiny body (doji) means something very different from a ? red candle with a large body. Color tells you volume intensity; the candlestick shape tells you the outcome of that volume battle.
-
Trading every red candle. Extra High volume is noteworthy, not automatically tradeable. It needs context — where in the trend, what price level, what other signals confirm it.
Quick Reference
| You See on Chart | Check Volume Window | Likely Meaning | Action |
|---|---|---|---|
| ? Red candle at S/R | Bar above Extra High line | Institutional-level activity at key level | High-priority setup — look for entry |
| ? Orange breakout candle | Bar above High line | Strong breakout with conviction | Confirm and enter |
| ? Yellow trend candles | Bars consistently above Medium line | Healthy trend momentum | Hold position |
| ? Teal for many bars | Bars flat below Normal line | Compression / low activity | Wait for spike, set alerts |
| ? Red against trend | Bar towers above all lines | Possible climax / exhaustion | Tighten SL, prepare for reversal |
| Color fading (?→?→?) | Bars getting shorter each wave | Momentum declining | Take partial profit, watch closely |
安全须知
本产品仅通过 MQL5.com 官方渠道获取。其他渠道版本可能缺少完整功能和技术支持。
EA 配置
| 交易品种 | XAUUSD |
| 时间框架 | H1 (推荐) |
| 推荐经纪商 | IC Markets, IC Trading |
| 最低存款 | $300 / 0.01手 |
📸 截图预览


