📝 产品详情
Volume NextGen
| 作者 | Murtadha Majid Jeyad Al-Khuzaie |
| 版本 | v1.20 |
| 激活数 | 0 |
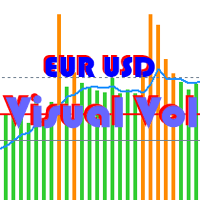
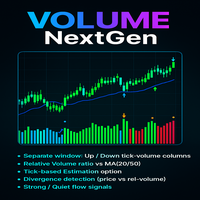
The Advanced Volume Flow Indicator is a free and practical tool who want to clearly see the balance between buying and selling pressure in the market. Instead of just showing total volume, this indicator separates volume into Up Volume (green bars) and Down Volume (red bars), making it easy to understand which side of the market is stronger at any moment.
The indicator also calculates a Relative Volume Line (blue), which shows whether the current trading activity is higher or lower than usual. When this line rises above its normal level, it signals that the market is active and strong. When it falls below, it shows the market is quiet or losing energy.
To make it even easier for traders, the indicator adds special arrows that highlight important signals:
Green arrows for possible bullish reversals (volume supports buyers).
Red arrows for possible bearish reversals (volume supports sellers).
Blue arrows for strong volume conditions (high conviction in the move).
Orange arrows for quiet volume conditions (low conviction, possible breakout ahead).
How to Read It
Look at the green and red bars in the separate window:
Green = buyers are stronger.
Red = sellers are stronger.
Watch the blue line (Relative Volume):
Above 1.0 → higher activity than normal.
Below 1.0 → weaker activity than normal.
Pay attention to the colored arrows:
Green arrow = bullish signal.
Red arrow = bearish signal.
Blue arrow = strong participation, trend may continue.
Orange arrow = quiet market, prepare for possible move.
That’s all you need! In just a few seconds, you can tell whether a price move is strong and supported by real volume or weak and likely to fail.
How It Works (Simplified)
The indicator checks the tick volume of each bar.
It splits that volume into “Up” (buying) and “Down” (selling).
Then it compares the current bar’s activity with the average of past bars.
If the activity is much stronger or weaker than normal, the indicator marks it with arrows and signals.
Everything is automatic — no need for complicated settings. Just attach it to your chart and trade with clearer vision.
Key Features
Clear Volume Split – See buyers vs. sellers in real-time with green and red bars.
Relative Volume Line – Quickly check if the market is active or quiet.
Automatic Divergence Alerts – Detect early reversals when price and volume disagree.
Strong & Quiet Flow Signals – Get simple arrows that show conviction or weakness.
Free & Lightweight – 100% free, fast .
Many traders struggle to understand whether price moves are real or fake. The Advanced Volume Flow Indicator makes this simple. With clear bars, an easy-to-read line, and automatic arrows, you’ll instantly know when the market has strong conviction or when it’s weak and risky.
Whether you trade trends, reversals, or breakouts, this tool gives you the confidence to act at the right time. And best of all, it’s completely free.
安全须知
本产品仅通过 MQL5.com 官方渠道获取。其他渠道版本可能缺少完整功能和技术支持。
EA 配置
| 交易品种 | XAUUSD |
| 时间框架 | H1 (推荐) |
| 推荐经纪商 | IC Markets, IC Trading |
| 最低存款 | $300 / 0.01手 |
📸 截图预览