📝 产品详情
Phoenix Fibonacci
| 作者 | Nigel Nii Darku Narnor Darko |
| 版本 | v1.0 |
| 激活数 | 0 |
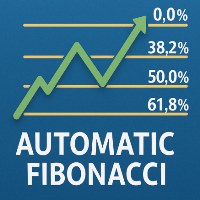
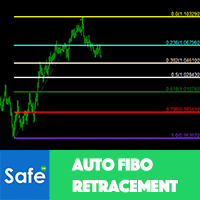
This indicator, often referred to as an Auto-Fibonacci Retracement Tool, is a technical analysis script designed to identify potential support and resistance levels based on the "Golden Ratio."
Unlike the standard manual tool, this version automatically scans a specific lookback period (e.g., the last 100 candles) to find the absolute Swing High and Swing Low, drawing the levels for you in real-time.
How to Use it for Trading
1. Entering a BUY Trade (Long)
You use the Fibonacci levels to find "discount" entries during an Uptrend.
Identify the Move: The indicator will draw from a low point up to a high point.
The Pullback: Wait for the price to drop (retrace) toward the 50.0% or 61.8% levels.
The Signal: Look for a bullish reversal candle (like a Hammer or Bullish Engulfing) touching these levels.
Entry: Buy when the price bounces off the 61.8% "Golden Pocket."
2. Entering a SELL Trade (Short)
You use the levels to find "expensive" entries during a Downtrend.
Identify the Move: The indicator will draw from a high point down to a low point.
The Pullback: Wait for the price to rise (retrace) back up toward the 38.2% or 61.8% levels.
The Signal: Look for a bearish reversal candle (like a Shooting Star) at these levels.
Entry: Sell when the price gets rejected at the 61.8% level.
3. Closing the Trade (Take Profit & Stop Loss)
Fibonacci levels provide mathematically sound "exit" targets:
Stop Loss: Place your stop-loss just beyond the next Fibonacci level. For example, if you buy at 61.8%, place your stop below the 78.6% or 100% (the start of the move).
Take Profit (TP1): Close half your position when the price returns to the 0% level (the previous high/low).
Take Profit (TP2/Extensions): If you add extension levels (like -27.2% or -61.8%), these act as "Target 2" for trending markets.
Why the "Ray" (Extended Line) is Important
By extending the lines to the right of the current candle, you can see future intersection points. If the price is approaching an extended 61.8% line that has acted as resistance multiple times in the past, it increases the probability that a reversal will happen again.
Pro-Tip: Fibonacci works best when "confluent" with other tools. For example, a 61.8% retracement that aligns exactly with a Previous Support Zone or a 200-period Moving Average is a very high-probability trade.
安全须知
本产品仅通过 MQL5.com 官方渠道获取。其他渠道版本可能缺少完整功能和技术支持。
EA 配置
| 交易品种 | XAUUSD |
| 时间框架 | H1 (推荐) |
| 推荐经纪商 | IC Markets, IC Trading |
| 最低存款 | $300 / 0.01手 |
📸 截图预览