📝 产品详情
Big Bull Scalper
| 作者 | Israr Hussain Shah |
| 版本 | v1.0 |
| 激活数 | 1 |
Big bull scalper
Short Description
Master market structure with the precision of the popular
Big bull scalper
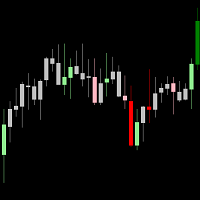
This tool automatically identifies key pivot highs and lows, plotting unique "angling" trend lines that dynamically define market context. It visually confirms Breaks of Structure (BOS) and Changes of Character (CHoCH), removing all guesswork from your analysis. Key Features:
Automatic Pivot Detection Instantly spots significant swing highs and lows.
Dynamic Angling Lines Visualizes the decay of momentum from pivots, offering a unique perspective on trend strength.
Clear Structure Confirmation Draws numbered, colored horizontal lines the moment a new market structure is confirmed.
Deviation Levels Plots three deviation levels (+1, +2, +3) from confirmed structures, providing potential profit targets and key support/resistance zones.
Full Customization Easily customize the color, style, and visibility of all lines and labels to match your chart template.
Integrated Chart Theme Includes a built-in theme to create a clean, professional trading environment with one click.
Perfect for swing and day traders who rely on pure price action. Stop manually drawing trend lines and let the indicator do the work for you.
How to Use for Buy & Sell Signals (Simple Guide)
This indicator simplifies market structure analysis. You don't need to be an expert to read the signals. Just follow the colors and arrow.
? Potential Buy (Bullish) Signals
Look for these three things to happen in order:
1. A green pivot arrow appears on the chart. This marks a potential significant high.
2. A dotted green line starts to angle downwards from that dot.
3. The price crosses and closes above that angling green line.
Action When the price crosses above the line, the indicator will draw a solid green horizontal structure line This confirms a "Break of Structure" and suggests bullish momentum. Consider looking for buy opportunities.
? Potential Sell (Bearish) Signals
Look for these three things to happen in order:
1. A **red pivot arrow appears on the chart. This marks a potential significant low.
2. A **dotted red line starts to angle upwards from that dot.
3. The price crosses and closes below that angling red line.
Action When the price crosses below the line, the indicator will draw a solid red horizontal structure line This confirms a bearish shift in momentum. Consider looking for sell opportunities.
Using Deviation Levels
The *white deviation lines (+1, +2, +3) that appear after a structure is confirmed can be used as potential profit targets or areas where the price might find support or resistance.
⚠️ Important Disclaimer:This indicator is a tool for analysis, not a standalone trading system. Always use it in conjunction with other forms of analysis (like support/resistance zones, other indicators, or price action patterns) and proper risk management. Past performance is not indicative of future results.
安全须知
本产品仅通过 MQL5.com 官方渠道获取。其他渠道版本可能缺少完整功能和技术支持。
EA 配置
| 交易品种 | XAUUSD |
| 时间框架 | H1 (推荐) |
| 推荐经纪商 | IC Markets, IC Trading |
| 最低存款 | $300 / 0.01手 |
📸 截图预览