📝 产品详情
Gaussian Envelope Indicator
| 作者 | Alfet Nigmatullin |
| 版本 | v1.0 |
| 更新 | 2026-04-14T11:55:13 |
| 激活数 | 0 |
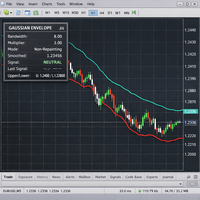
Gaussian Envelope is a powerful technical indicator based on kernel smoothing with a Gaussian kernel. The indicator builds a dynamic price channel that adapts to market conditions and provides clear entry signals when the channel boundaries are breached.
Unlike classic Bollinger Bands or Envelopes, Gaussian Envelope uses non-linear weighted smoothing, making it more sensitive to local price changes and less prone to lag.
✨ Key Features
-
Adaptive Smoothing — uses Gaussian kernel for weighted price averaging
-
Two Operating Modes — Repainting and Non-Repainting modes
-
Visual Signals — ▲ and ▼ arrows when channel boundaries are breached
-
Information Dashboard — displays all current parameters and signals in real time
-
Customizable Colors — full visual customization
-
High Performance — optimized for any timeframe
? How It Works
The indicator calculates a weighted moving average of prices using a Gaussian weighting function. Weights decrease exponentially as the distance from the current bar increases, providing smooth smoothing without losing sensitivity to local changes.
Calculation Formula:
-
Center line — weighted average with Gaussian kernel
-
Upper/Lower boundaries = center line ± MAE × Multiplier
-
MAE (Mean Absolute Error) — average absolute deviation
? Input Parameters
| Parameter | Description | Default Value |
|---|---|---|
| Bandwidth | Bandwidth parameter (h). Lower values make the line more sensitive to price | 8.0 |
| Multiplier | Multiplier for channel width calculation. Affects the distance between boundaries | 3.0 |
| Repainting Smoothing | Repainting mode. When enabled, historical lines may change | true |
| Up Color | Color of upper band and buy signals | Teal |
| Down Color | Color of lower band and sell signals | Red |
| Show Dashboard | Display information panel | true |
| Dashboard X/Y | Dashboard position on the chart | 10, 10 |
? Trading Signals
SELL Signal (▼)
Condition: Price closes breaking the upper boundary from top to bottom
Interpretation: Bearish impulse, possible start of downward movement
Recommendation: Consider short positions
BUY Signal (▲)
Condition: Price closes breaking the lower boundary from bottom to top
Interpretation: Bullish impulse, possible start of upward movement
Recommendation: Consider long positions
Neutral Zone
Condition: Price inside the channel
Interpretation: Consolidation, no clear signal
Recommendation: Wait for a signal or use other indicators
? Information Dashboard
The dashboard displays in real time:
-
Bandwidth — current bandwidth value
-
Multiplier — current multiplier value
-
Mode — operating mode (Repainting / Non-Repainting)
-
Smoothed — current smoothed line value
-
Signal — current signal (BUY/SELL/NEUTRAL)
-
Last Signal — time of the last signal
-
Upper/Lower — current boundary values
? Operating Modes
Repainting Mode
-
Indicator displays only on the last 500 bars
-
Lines and signals may change as new data arrives
-
Advantage: Maximum accuracy on the current bar
-
Disadvantage: Historical signals may change
Non-Repainting Mode
-
Indicator calculates for all bars
-
Historical values are fixed and do not change
-
Advantage: Reliable backtesting data
-
Disadvantage: Slight lag behind price
? Usage Recommendations
Optimal Settings
-
Bandwidth: 8-12 for daily charts, 4-8 for hourly charts
-
Multiplier: 2-4 depending on volatility
-
Mode: Non-Repainting for backtesting, Repainting for live trading
Combinations with Other Indicators
-
Trend Confirmation: Use with Moving Average or MACD
-
Signal Filtering: Add RSI or Stochastic
-
Volume: Cross-check signals with volume indicators
Timeframes
-
Scalping: M1-M5 (requires parameter optimization)
-
Short-term Trading: M15-H1
-
Swing Trading: H4-D1 (recommended default settings)
⚠️ Limitations and Risks
-
The indicator does not guarantee 100% signal accuracy
-
During low volatility periods, many false signals may occur
-
Repainting mode is not suitable for backtesting
-
Requires at least 500 bars of history to work
? Technical Requirements
-
Platform: MetaTrader 5
-
Minimum terminal version: build 2000+
-
Required history: at least 500 bars
-
Instrument types: any (forex, CFD, futures, stocks, cryptocurrencies)
安全须知
本产品仅通过 MQL5.com 官方渠道获取。其他渠道版本可能缺少完整功能和技术支持。
EA 配置
| 交易品种 | XAUUSD |
| 时间框架 | H1 (推荐) |
| 推荐经纪商 | IC Markets, IC Trading |
| 最低存款 | $300 / 0.01手 |
📸 截图预览