📝 产品详情
Market Profile FX
| 作者 | Nguyen Duc Quy |
| 版本 | v1.0 |
| 更新 | 2018-09-24T15:55:38 |
| 激活数 | 5 |
| 原价 | $50 USD |
1. Price Histogram
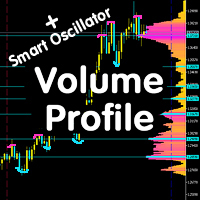
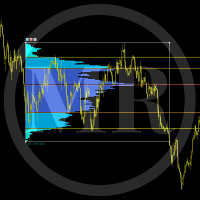
The Price Histogram is a very reliable tool. It's a bit intuitive but extremely effective. The price histogram simply shows you the "most convenient" trading points of the market. This is aa leading indicator, because it shows the points where market can change its direction in advance. The indicators like moving averages or oscillators cannot specify the exact points of resistance and support, they can only show the fact whether the market is overbought or oversold.
Usually, the Price Histogram (or Market Profile) is applied to 30 min. price charts to study the market activity during one day. I prefer to use the 5 min. charts for stock markets and 15-30 min. charts for FOREX.
2. Point of Control
What does POC show? The price that is remembered by most of traders. The longer market is traded at this price, the longer market remembers it.
Psychologically POC acts as a center of attraction.
安全须知
本产品仅通过 MQL5.com 官方渠道获取。其他渠道版本可能缺少完整功能和技术支持。
EA 配置
| 交易品种 | XAUUSD |
| 时间框架 | H1 (推荐) |
| 推荐经纪商 | IC Markets, IC Trading |
| 最低存款 | $300 / 0.01手 |
📸 截图预览