📝 产品详情
RSI Dashboard Pro
| 作者 | Abderrahmane Benali |
| 版本 | v3 |
| 激活数 | 5 |
| 原价 | $49 USD |
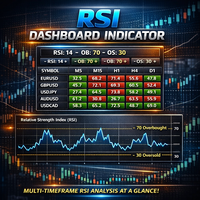
RSI Dashboard PRO is a multi-symbol, multi-timeframe RSI monitoring indicator designed to help traders analyze Relative Strength Index values efficiently within a single panel.
The indicator displays real-time RSI readings for selected symbols and timeframes, using a clear color scheme to highlight overbought, oversold, and neutral conditions. This allows users to quickly compare market states and identify areas of interest without switching charts.
RSI Dashboard PRO includes interactive controls for fast symbol and timeframe selection, as well as flexible settings for RSI period, applied price, threshold levels, and colors.
The interface is lightweight and optimized for smooth performance, making it suitable for continuous chart monitoring.
Main Features
-
Multi-symbol RSI display
-
Multi-timeframe support
-
Real-time RSI calculation
-
Color-based visualization of RSI zones
-
One-click symbol and timeframe selection
-
Customizable RSI parameters and levels
-
Works with Forex, indices, commodities, and cryptocurrencies
RSI Dashboard PRO is intended as an analytical tool to assist technical analysis.
安全须知
本产品仅通过 MQL5.com 官方渠道获取。其他渠道版本可能缺少完整功能和技术支持。
EA 配置
| 交易品种 | XAUUSD |
| 时间框架 | H1 (推荐) |
| 推荐经纪商 | IC Markets, IC Trading |
| 最低存款 | $300 / 0.01手 |
📸 截图预览