📝 产品详情
Wave Vision 5
| 作者 | Andrey Sorokin |
| 版本 | v1.1 |
| 更新 | 2020-03-19T18:36:52 |
| 激活数 | 0 |
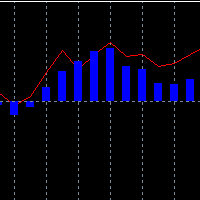
The technical indicator Wave Vision measures the relative strength of the trend movements of the price from its average values over a certain time period. The histogram shows price movement strenght relative to the zero level line. Histogram values close to zero indicate the equality of forces between buyers and sellers. Above the zero level line - bullish trend (positive values of the bar chart). Below the zero level line - bearish trend (negative values of the bar chart).
Settings:
Smoothing Filter (default) = 10.
Warning (blue line) = 5.
Signal (red line) = 9.
Horizon (gold line) = 14.
Actions of the trader depend on the values of the histogram and signal lines and their location on the indicator chart relative to each other, as well as relative to the zero level line. The most commonly used indicator signals are intersections, histogram transition from the zone of negative values to the zone of positive values and vice versa, discrepancies in the indicator and price, as well as overbought / oversold conditions.
https://www.mql5.com/en/users/meijin/seller安全须知
本产品仅通过 MQL5.com 官方渠道获取。其他渠道版本可能缺少完整功能和技术支持。
EA 配置
| 交易品种 | XAUUSD |
| 时间框架 | H1 (推荐) |
| 推荐经纪商 | IC Markets, IC Trading |
| 最低存款 | $300 / 0.01手 |
📸 截图预览