📝 产品详情
Candle Flowing PnL on Chart
| 作者 | Eugen-alexandru Zibileanu |
| 版本 | v1.14 |
| 激活数 | 78603 |
Candle Flowing PnL on Chart
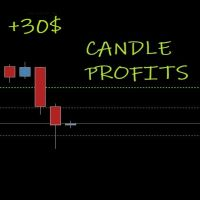
This indicator shows PnL realised profits or losses flowing live on chart above or below candle were it took place.
The nice part is it groups the same candle result, for example if you closed a grid with multiple positions you will see the result of candle PnL grouped.
Basically this indicator helps trading directly from the chart, no need for toolbox windows, you can see live current open PnL , already cloed positions PnL and Today realised PnL
You can switch to monthly/weekly/daily etc chart to see direct results over the respective candle.
It can work really nice with any Grid EA so you can see the information on the Chart directly.
Also this helps to hide sensitive information of your account if you share video, picture or livestream of your trades and want to show/demonstrate curent position/trades results.
SETTINGS:
DisplayMode: Display only money or Display Points or Both
ShowOnlyLastN: True or False switches MaxCandles On or OFF to show on history of realised PnL on chart
MaxCandles: The number of candles to show realised Pnl
Increase Distance of results numbers from the candle.
安全须知
本产品仅通过 MQL5.com 官方渠道获取。其他渠道版本可能缺少完整功能和技术支持。
EA 配置
| 交易品种 | XAUUSD |
| 时间框架 | H1 (推荐) |
| 推荐经纪商 | IC Markets, IC Trading |
| 最低存款 | $300 / 0.01手 |
📸 截图预览