📝 产品详情
Tick Profile Free
| 作者 | Elia Burstein |
| 版本 | v1.0 |
| 更新 | 2019-09-29T10:48:32 |
| 激活数 | 0 |
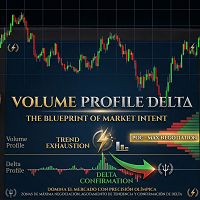
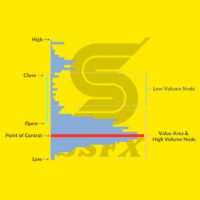
This indicator will show a vertical representation of the volume distribution within a selected user range.
Main features:
- This Indicator will create an image that will allow viewing the tick volume per price level in a graphical form.
- The indicator will work on any range size in any time-frame, limited only by your computer memory and performance.
- Recommended time-frames are: M1 to H1.
Inputs:
- Price Calculated - select the desired price source. Either Bid or Ask.
- Vertical Lines Color - Select the desired color for the vertical lines that define the calculation range.
- Activate Real-time Mode - Select Yes to activate real-time mode that will update the result after every tick (not more then once per
second).
This mode will work with only one vertical line that defines the beginning of the range. The end of the range will be the last tick received.
Usage:
- Drag the vertical lines to select data range for analysis.
Note:
- Recommended to use with a dark background, for best contrast
- Results may vary between brokers for obvious reasons.
安全须知
本产品仅通过 MQL5.com 官方渠道获取。其他渠道版本可能缺少完整功能和技术支持。
EA 配置
| 交易品种 | XAUUSD |
| 时间框架 | H1 (推荐) |
| 推荐经纪商 | IC Markets, IC Trading |
| 最低存款 | $300 / 0.01手 |
📸 截图预览