📝 产品详情
TSI Trend Analyzer
| 作者 | Joao Paulo Ferreira Fortes |
| 版本 | v2.0 |
| 更新 | 2020-04-28T20:32:12 |
| 激活数 | 0 |
In which direction should I trade today? For “TREND followers”, we need to determine the TREND.
This indicator determines the Trend based on the price High, Low and Close of every bar, for a given period and timeframe. Calculating and plotting the Trend UP and Trend DOWN lines.
If the:
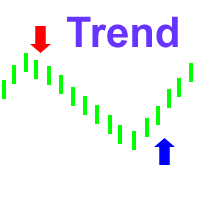
- “Trend UP” line (Green) is above the “Trend DOWN” line (Red), then it is a BULLISH Trend (see "Screenshots" tab).
- “Trend DOWN” line (Red) is above the “Trend UP” line (Green), then it is a BEARISH Trend (see "Screenshots" tab).
As input, you select a timeframe to determine the Trend (variable TIMEFRAME_period). Eg. if you trade on a M15 Chart, you can select a higher timeframe like H1 (4x higher is appropriate), to determine the Trend. So basically, on a M15 Chart you will see the H1 Trend without having to switch to another Chart window.
Input Parameters
- Number of Bars to calculate: predefined value to reduce performance impact on the hardware. Adjust it accordingly to view more or less historic data.
- TIMEFRAME_period : Timeframe to determine the trend. You need to select a timeframe higher or equal to the current one.
Output Buffers
- Buffer 0 : Trend UP value
- Buffer 1 : Trend DOWN value
Note:
Soon to be released, a more advanced and fully featured Trend indicator named “TSI Trend Stepper”. Where specific TREND entry zones are plotted in different colors, for both Long and Short positions. More details coming soon …
安全须知
本产品仅通过 MQL5.com 官方渠道获取。其他渠道版本可能缺少完整功能和技术支持。
EA 配置
| 交易品种 | XAUUSD |
| 时间框架 | H1 (推荐) |
| 推荐经纪商 | IC Markets, IC Trading |
| 最低存款 | $300 / 0.01手 |
📸 截图预览