📝 产品详情
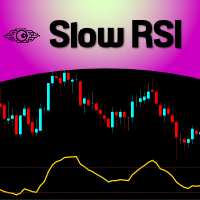
Slow RSI
| 作者 | Flavio Javier Jarabeck |
| 版本 | v1.0 |
| 更新 | 2020-10-30T01:32:15 |
| 激活数 | 0 |
For those who feel that regular RSI is too fast and too noisy to be used on regular trades or in EAs and want to have an alternative to meter the Momentum of the Price, here is a solution presented on the great article of the Technical Analysis of Stocks & Commodities magazine (April, 2015), by Vitali Apirine, called: Slow Relative Strenght Index.
Its reading is almost the same as the regular RSI, but its levels of Overbought and Oversold are 80 and 20 instead. SRSI is very powerful to show divergencies between Price and the oscillator. As with all indicators out there, you must calibrate it to your liking/strategy/symbol/timeframe.
HOW TO READ THE SRSI
- You can use it as centerline crossovers.
- Overbought/Oversold (80/20) level analysis.
- Divergencies between Price and the SRSI.
SETTINGS
- Period (past bars) for analysis
- Smoothing level to apply to the RSI result
- Price Type to use for the analysis
- Overbought and Oversold levels and Styles
Enjoy!
If you like this indicator, all I am asking is a little Review (not a Comment, but a REVIEW!)...
This will mean A LOT to me... And this way I can continue to give away Cool Stuff for Free...
With No Strings Attached! Ever!
Live Long and Prosper!
;)安全须知
本产品仅通过 MQL5.com 官方渠道获取。其他渠道版本可能缺少完整功能和技术支持。
EA 配置
| 交易品种 | XAUUSD |
| 时间框架 | H1 (推荐) |
| 推荐经纪商 | IC Markets, IC Trading |
| 最低存款 | $300 / 0.01手 |
📸 截图预览