📝 产品详情
Pivot Levels of Day Or Week Or Month
| 作者 | Nikolay Mitrofanov |
| 版本 | v1.1 |
| 更新 | 2021-03-06T17:18:24 |
| 激活数 | 78603 |
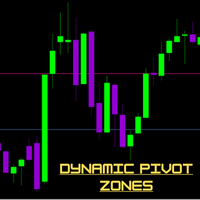
The utility draws pivot levels based on a selection from
- day
- week
- month
The previous candlestick of the selected timeframe is taken and the values for the levels are calculated using the following formulas:
Pivot = (high + close + low) / 3
R1 = (2 * Pivot) - low
S1 = (2 * Pivot) - high
R2 = Pivot + (R1 -S1)
R3 = high + (2 * (Pivot - low))
S2 = Pivot - (R1 - S1)
S3 = low - (2 * (high - Pivot));
The style and thickness for all lines are adjusted.
The colors for the R, Pivot and S lines are adjusted separately.
When the utility is removed from the chart, the lines are removed.
There is also such a utility https://www.mql5.com/en/market/product/63805
It gives you more options.
安全须知
本产品仅通过 MQL5.com 官方渠道获取。其他渠道版本可能缺少完整功能和技术支持。
EA 配置
| 交易品种 | XAUUSD |
| 时间框架 | H1 (推荐) |
| 推荐经纪商 | IC Markets, IC Trading |
| 最低存款 | $300 / 0.01手 |
📸 截图预览